How To Create a Data Watch Monitor
Data Watches are a type of Monitor that Admins can create. They quickly and easily start tracking, alerting, and visualizing the health of data ingests being indexed in Splunk. This can empower Splunk admins to quickly find and triage issues in their environment and ensure accurate reporting. Follow these steps to quickly get set up with a Monitor on critical data streams.
Will this impact my Splunk environment?
Atlas utilizes advanced capabilities to reduce load on your environment and ensure its impact remains small. Check out Why Use Monitor for more details! ::::
Create a Data Watch
Identify an appropriate Monitor Group and open the edit modal. For assistance, follow the steps on Monitor Group Creation
Next, select the Add Data Watch button on the modal. This will open up the Data Watch Modal.
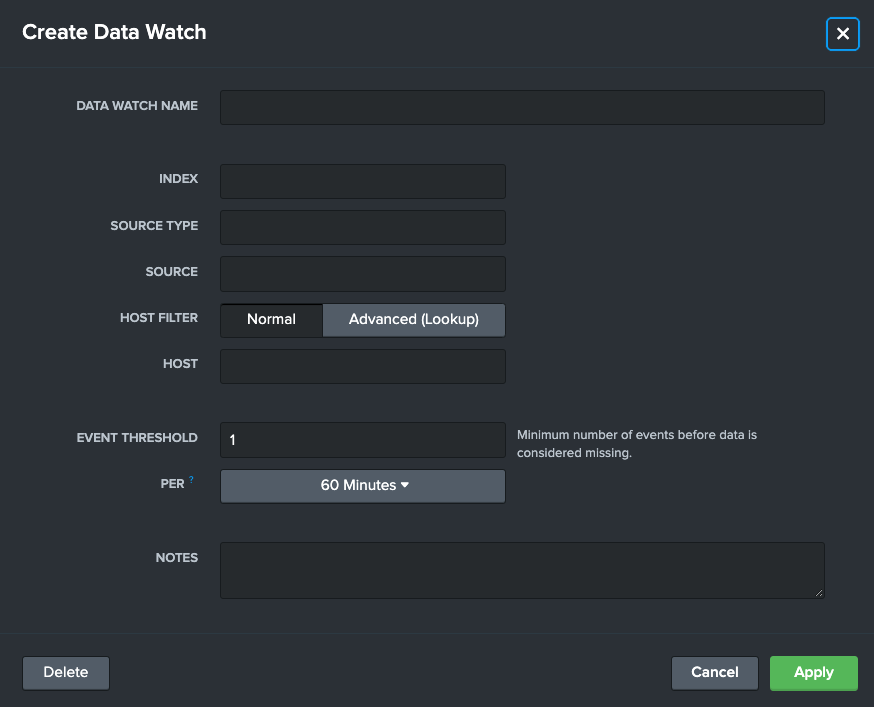
Use the details below to fill out the form.
Data Watch Name (Required): A readable name that describes the data being watched such as "Windows Logs", "Palo Alto Firewall Data", or "Log In info"
Index (Required): A Splunk index that is being monitored
Source Type: An optional input to narrow down the monitor to a source type level
Source: An optional input to narrow down the monitor to an individual source level
Host Filter: An option that enables advanced integrations with Splunk Lookups, see Integrating a Lookup with a Data Watch
Host An optional input to narrow down the monitor to an individual host level
Event Threshold (Required): An amount of events that if this Data Watch falls below (in the "Per" time range) will mark it as "In Alert" and the start of an "Outage"
Setting the Event Threshold to "1" will mark the data ingest as healthy, unless no data is found :::
Per: A time range that the Event Threshold is held to, such as "500 events every hour"
Notes: A text box to record additional notes as needed
After filling out the required fields and any additional fields to meet the use case, select "Apply" to enact the Data Watch. This will start the monitoring process.
Data Watches will take the amount of time identified in the Event Threshold before they accurate report findings. For example, a Data Watch created that has a threshold of "500 Events per Hour" will take at least an hour before it accurately reports on the Monitor Groups and Monitor Report dashboards.
Editing a Data Watch
Data Watches can be tweaked and tuned after creation. This is useful for creating actionable thresholds and refactoring time spans to reflect ingest rates. To edit a Data Watch, open up the Edit Monitor Group modal, and inspect the list of Configured Monitors at the bottom of the modal.
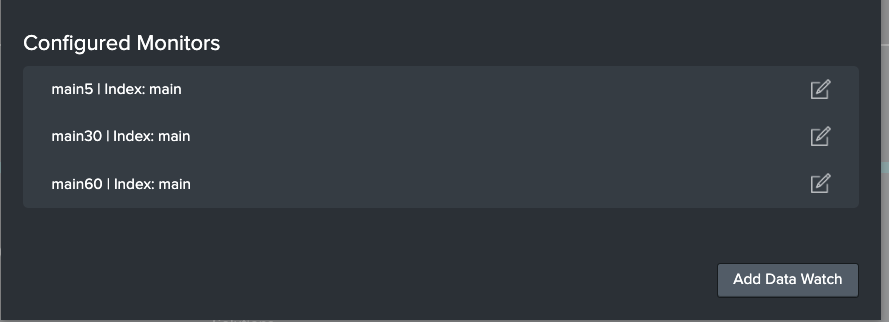
Select the Edit button on the right. This will bring up the familiar Data Watch modal as before. Admins can tweak any of the fields to reflect their updated needs. Admins can also delete Data Watches here.
Changing the Index, Source Type, Source, or Host fields will require the Data Watch an appropriate amount of time as identified in the Event Threshold before giving accurate results.
Data Watch Example
For this Use Case, Alex from IT Security wants to ensure their security dashboards are accurate and up to date in Splunk. To achieve this peace of mind, Alex utilizes Monitor to ensure that if a Splunk data stream fails, they are the first to know.
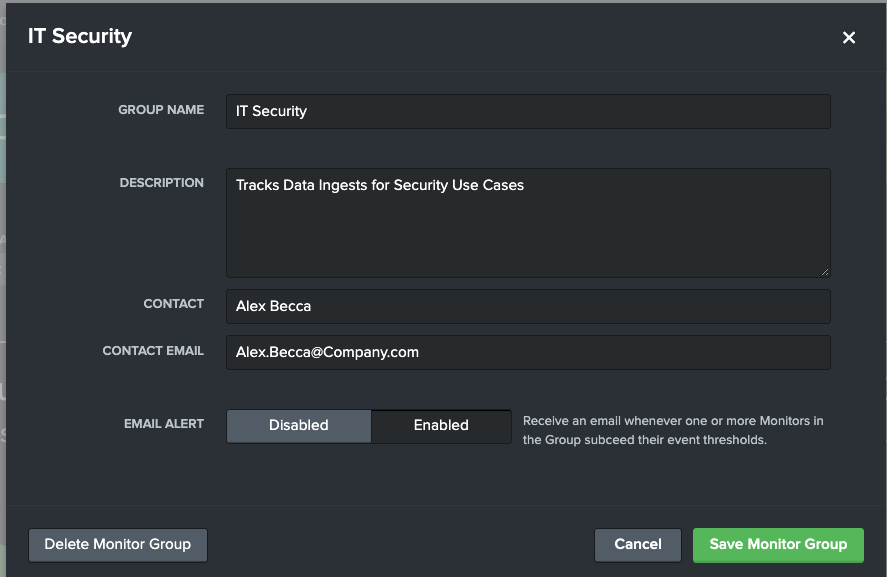
Alex creates an IT Security Monitor Group to capture all the Monitors they are planning on creating.
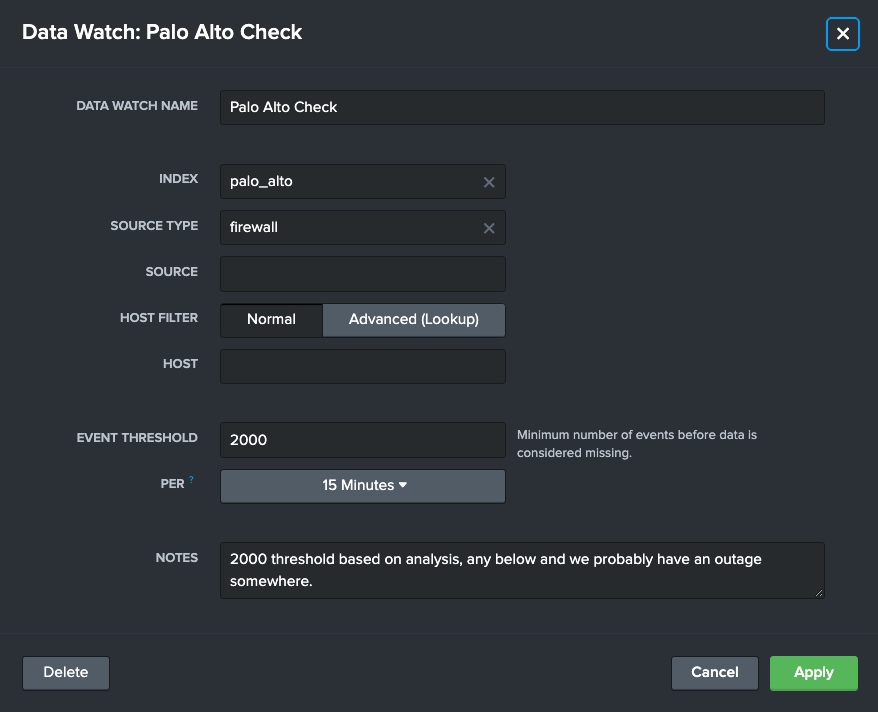
They then add a couple Data Watches. Let's look at one Alex created to ensure that their team is getting the latest Palo Alto network data. This Data Watch would ensure Alex gets alerted if there are less than 2 thousand events every 15 minutes in this Index - Source Type.