Using Monitor
Atlas Monitor
With Atlas Monitor, you can watch, track, and get alerted on Splunk data ingests with unparalleled visibility by creating Monitors. Utilize Atlas Monitor's built-in alerting and outage insights to understand and improve your data robustness.
Monitors Overview Dashboard
The Monitors Overview dashboard is a great way to get a birds-eye view of your environment's Data Watches. Each group's name, description, current health, and owner are shown in that group's tile. You can hide or show certain groups or extend or shorten the time range in question with the filtering options at the top of the page. This allows you to get the information you need quickly and efficiently.
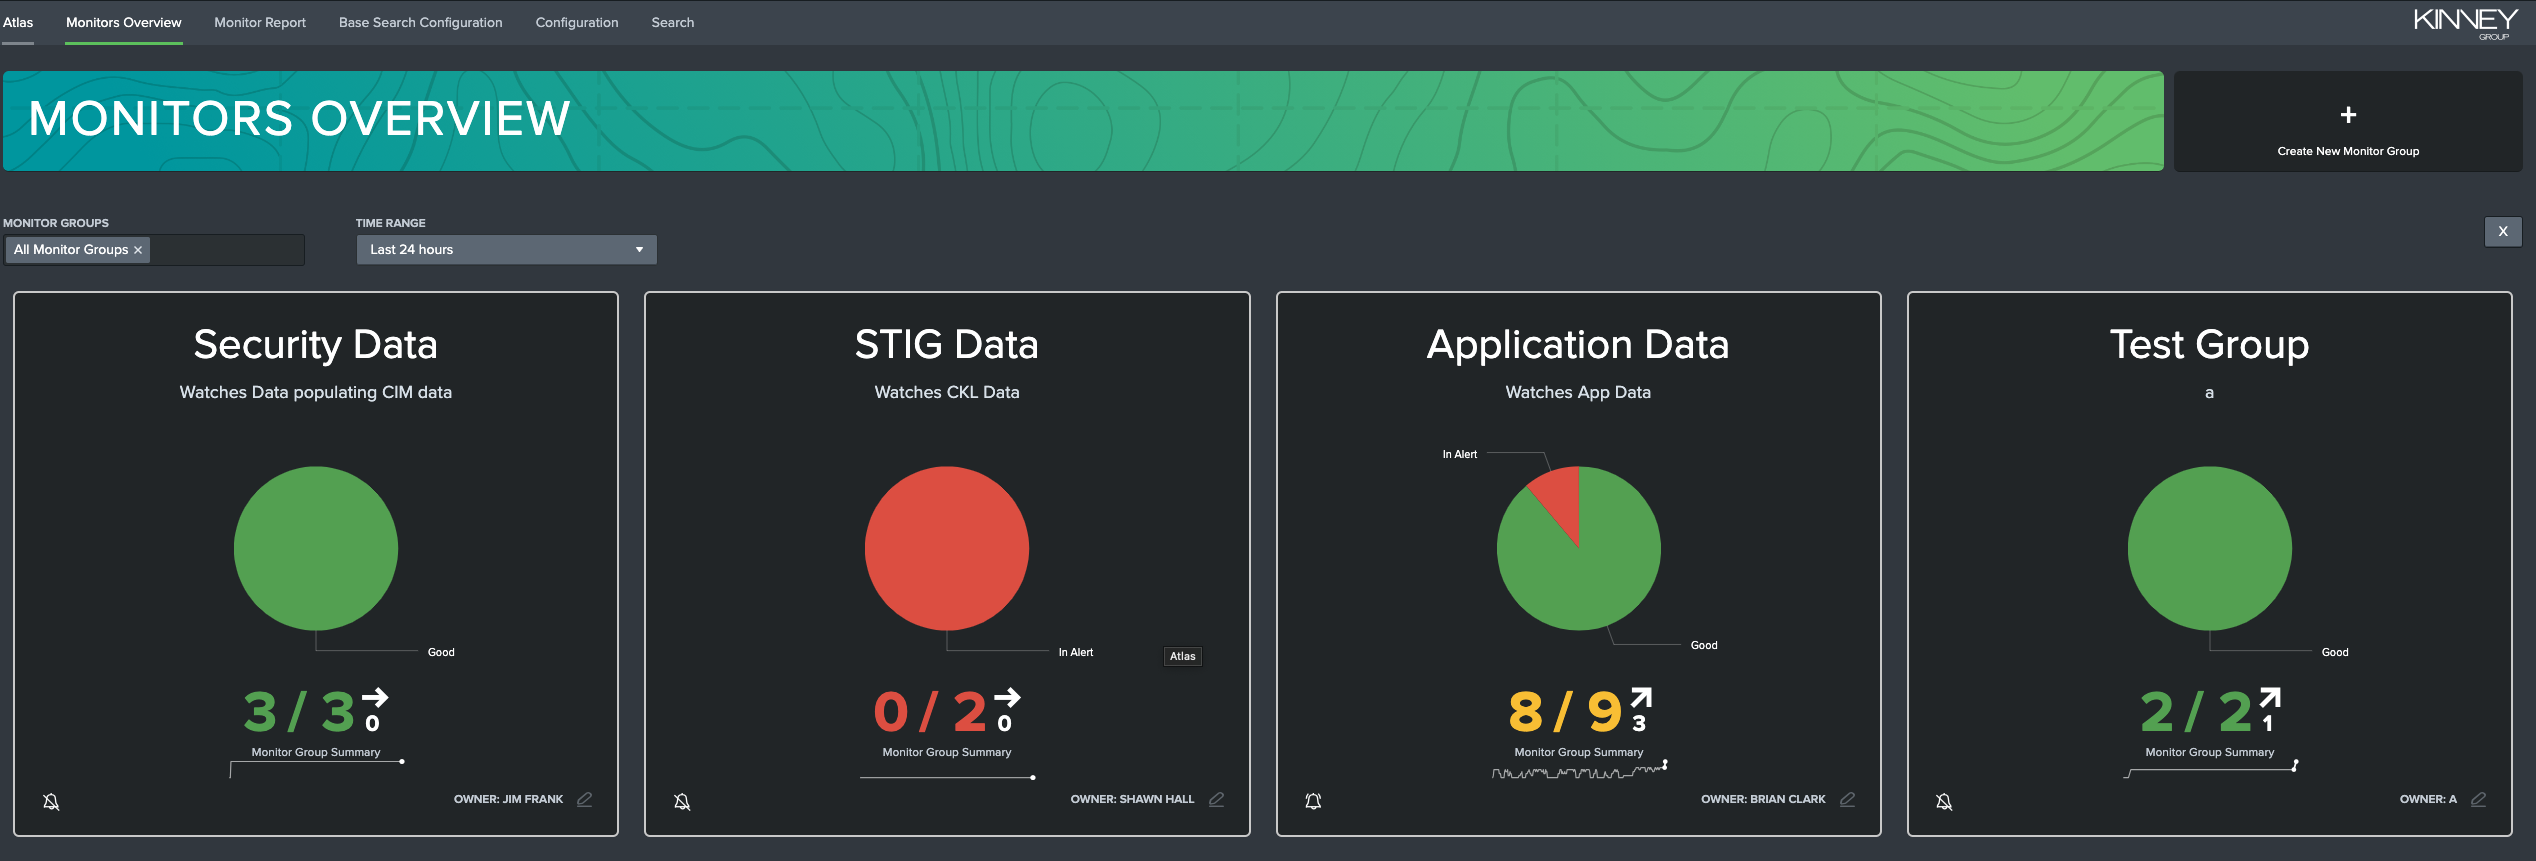
Clicking on any of these groups' tiles will open that group's report in the Monitor Report dashboard, which will be explained in the next section. You can, if you have the correct permissions, edit the group's information by clicking on the edit button in the lower-right corner of each tile.
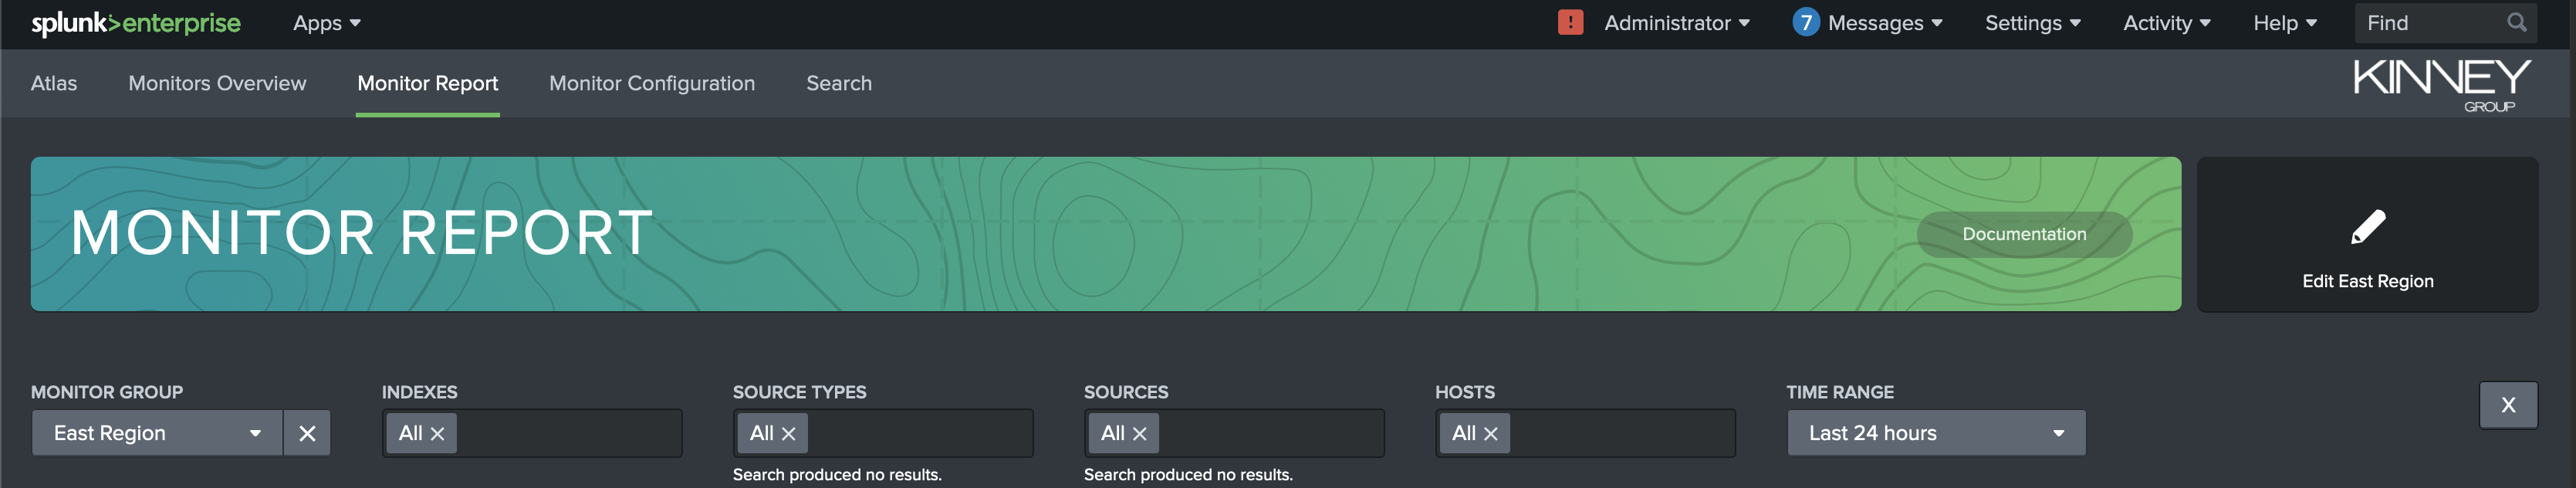
Monitor Report Dashboard
The Monitor Report dashboard allows you to view more detailed information about a single Monitor Group. The top of the tab contains filters to allow you to easily find and select the Monitor Group you're interested in. You can also select a time range that determines from when the results and alerts shown are gathered.
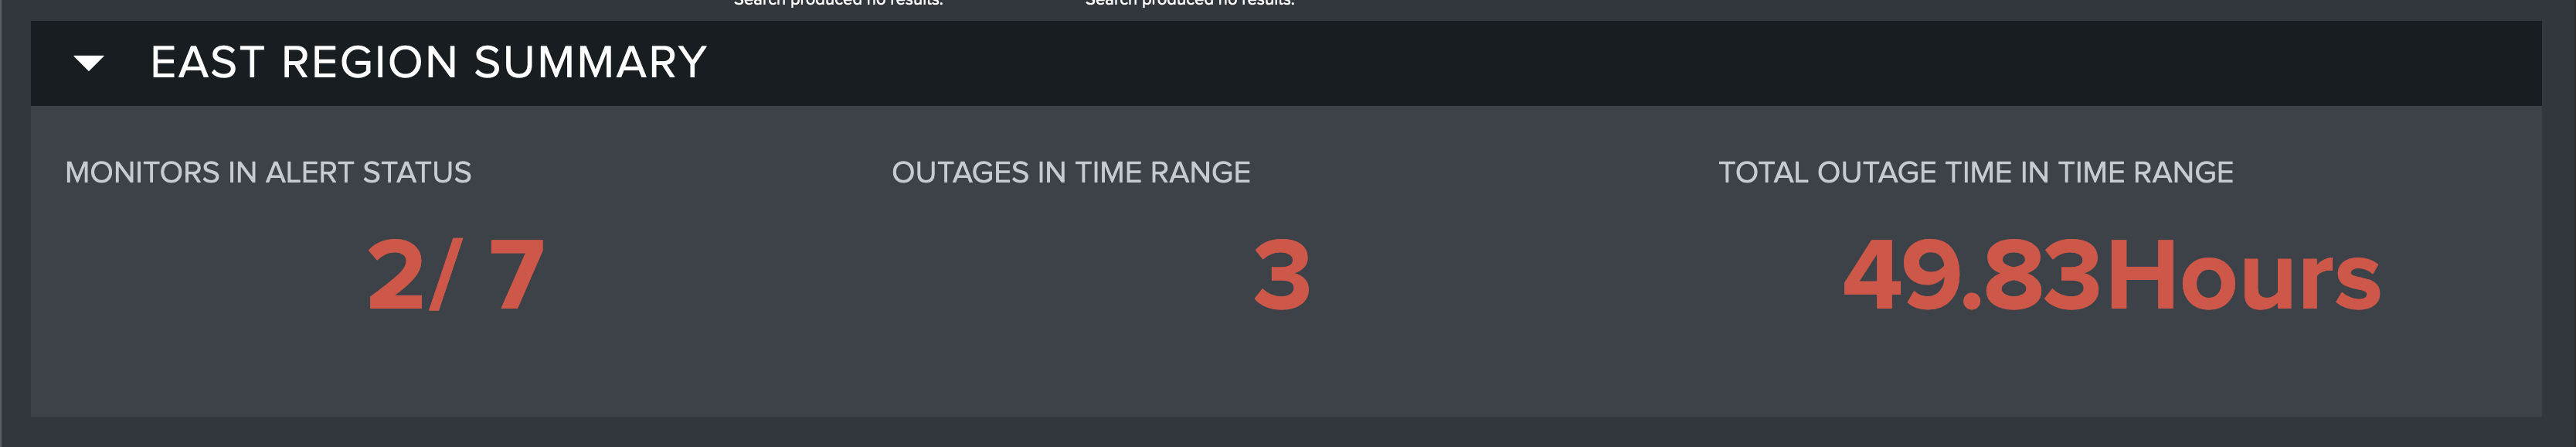
Monitor Group Summary
The first dashboard of Monitor Report shows high-level KPIs (Key Performance Indicators) for the selected Monitor Group. These KPIs are designed to give you an idea about the status of the Group at a quick glance. These indicate:
- The number of Monitors in Alert status
What does it mean for a Monitor to be 'In Alert'?
Monitors in Alert status have failed to reach their last event threshold
- The number of Outages in the Time Range you have selected
What is an 'Outage'?
An Outage is defined as the amount of time a Monitor was consecutively in an 'Alert' state
- The amount of time (in hours) in the chosen Time Range spent in an Outage
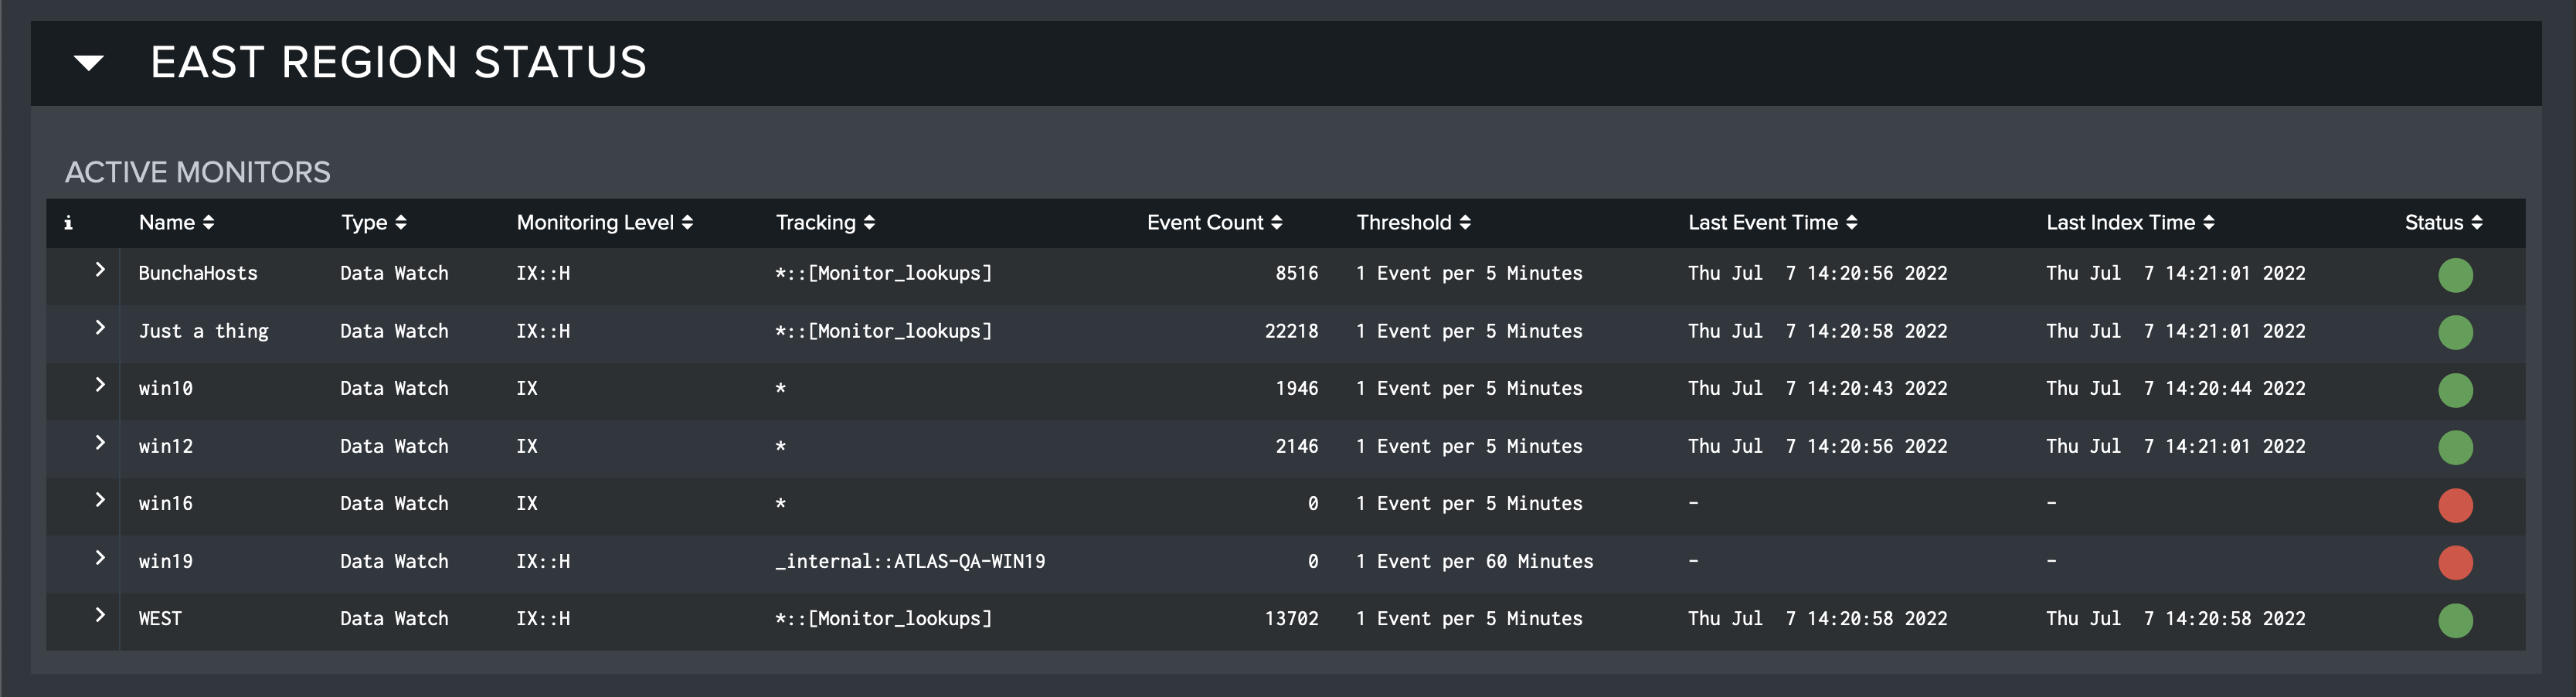
Monitor Group Status
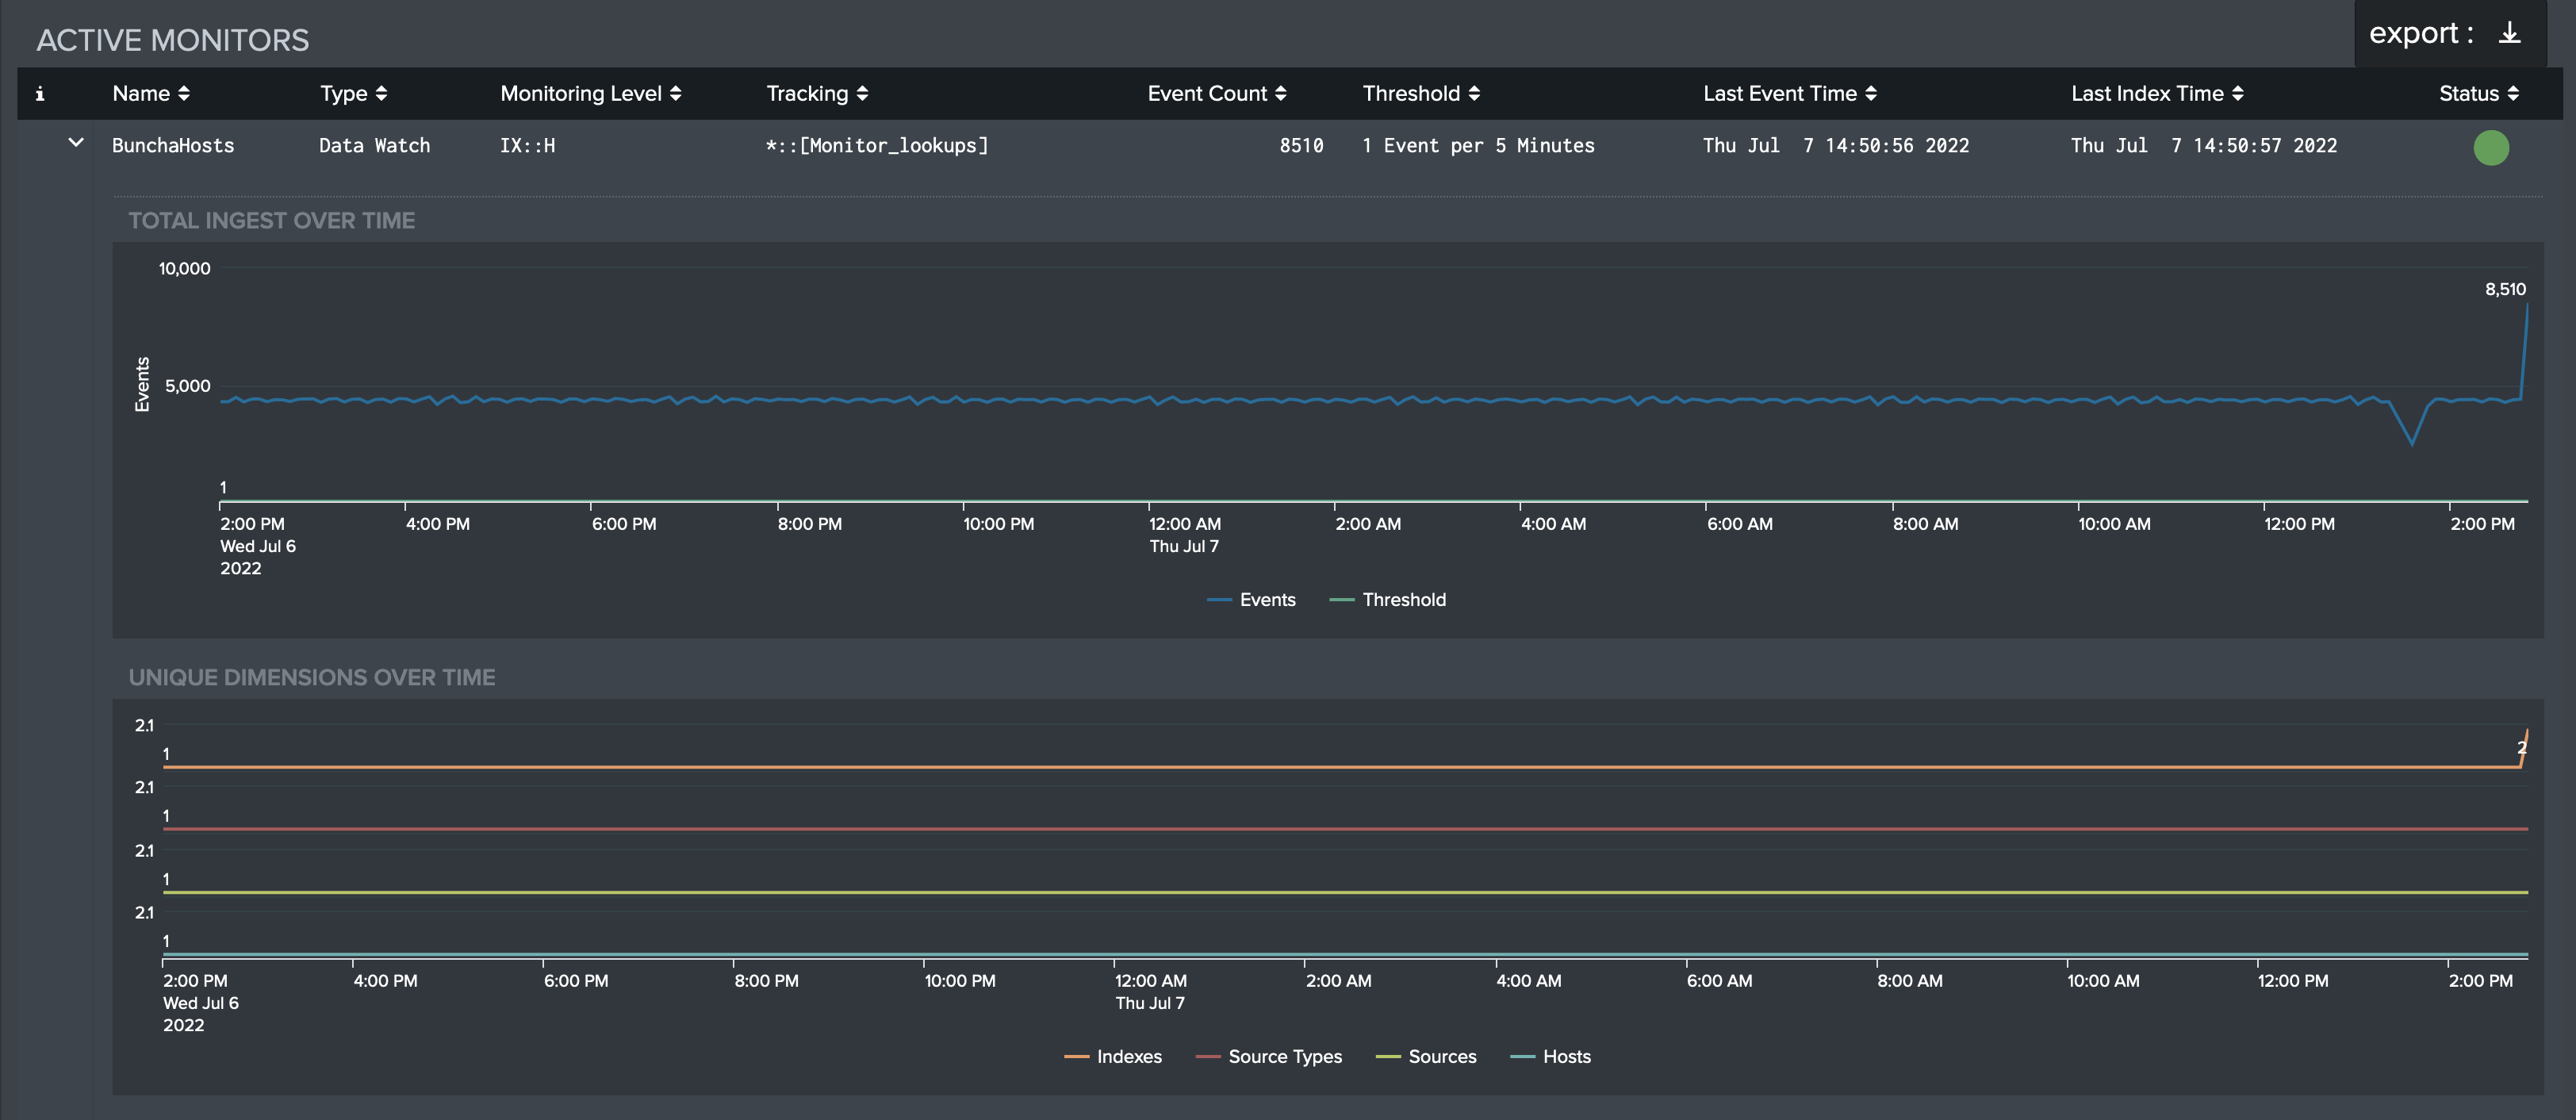
The second dashboard of Monitor Report is a more detailed, exportable report of each monitor in the selected group. This table gets more into the nitty-gritty of each Monitor, indicating:
The Monitor's name and type
What the Monitor is tracking
The number of events and the event threshold
When the last event occurred and when the Monitor was last indexed
The current status of the Monitor (healthy/unhealthy)
As mentioned above, this table can be exported. This can be done by hovering over the table and clicking the button that appears in the top-right corner. The 'Export Results' modal appears and the format (CSV, XML, or JSON), name, and desired number of results can be chosen. Each entry in the table can also be clicked to drill down and expose charts of the Total Ingest used by the Monitor over the Time Range specified and the number of Unique Dimensions over the Time Range specified.
Monitor Group Outages
The third and final dashboard of Monitor Report contains a table similar to the table in Monitor Group Status. This table contains that information which pertains to Outages. In addition to the fields shown in Monitor Group Status, this table includes:
When the Outage started and ended
The estimated duration of the Outage
The average percentage of the event threshold reached
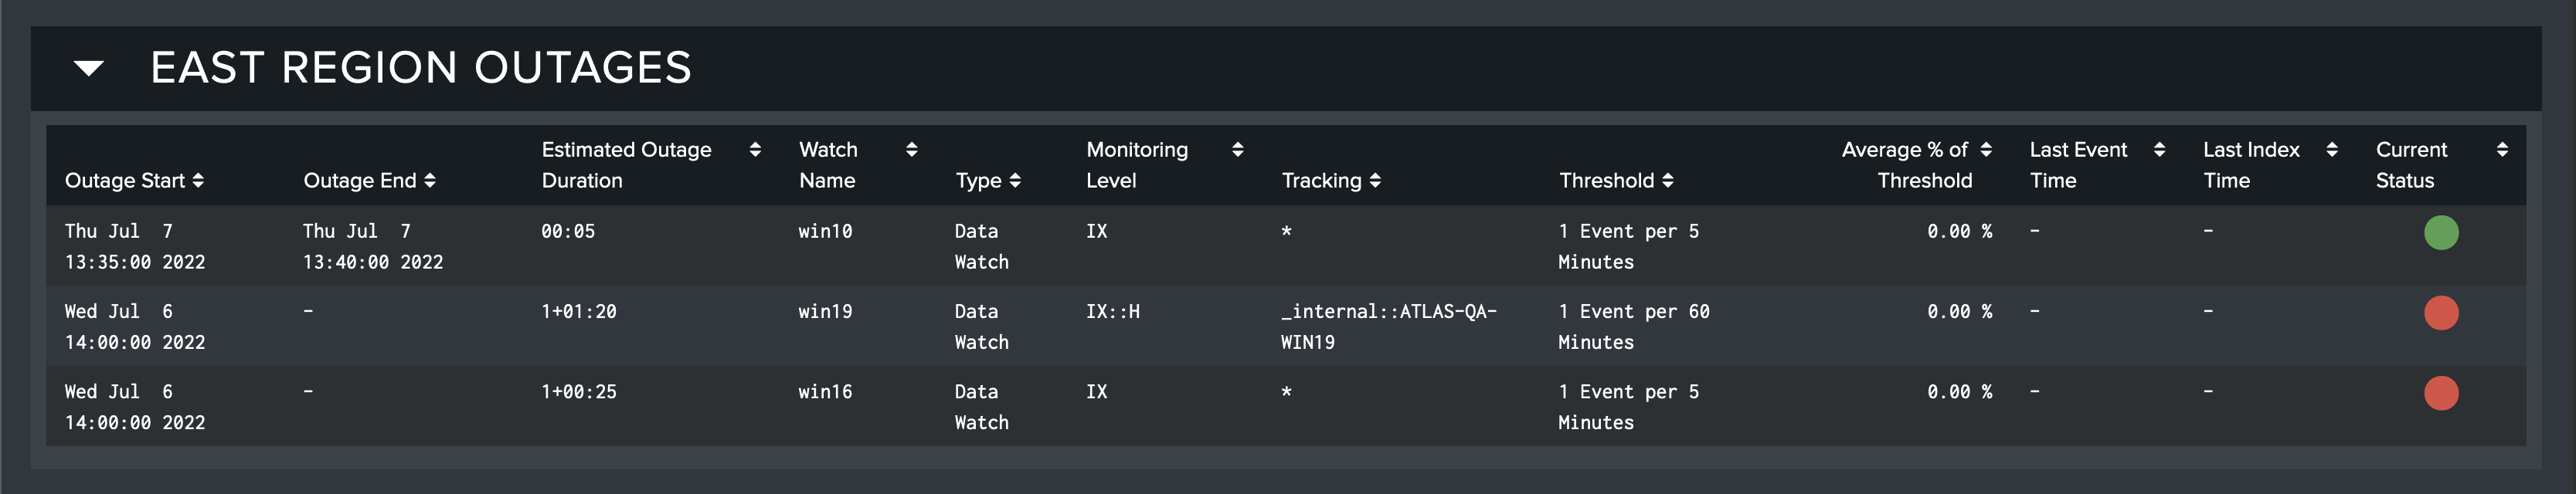
This table can also be exported in a similar manner to the Monitor Group Status table.
Configuration
The Monitor Configuration dashboard is concerned with the requirements of using Atlas Monitor. Monitor will not function as-intended if improperly configured. Luckily, this tab will check each requirement of the app. If it finds something wrong, it will alert you and provide some guidance on how to fix the incorrect configuration. It is recommended to reach out to Expertise on Demand to solve any raised issues.
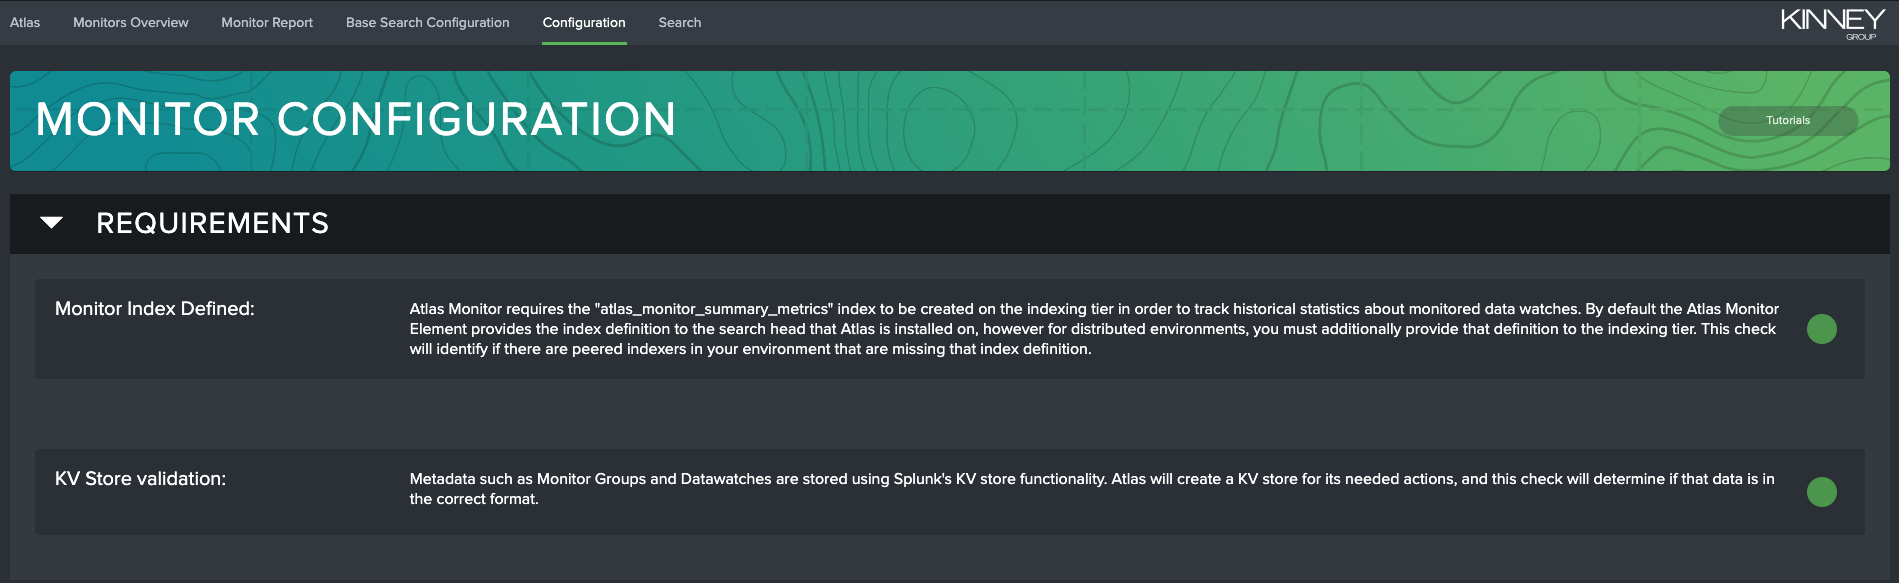
Requirement 01: Monitor Index Defined
The atlas_monitor_index macro must be set to a valid metrics index defined on the Search and Indexing tiers. If it is, you will see a green dot reported as status. If the status is red, then the metric index is unset or missing.
Requirement 02: Valid KV Store
For Atlas Monitor to function properly, the correct fields must be present in the Monitor KV Store. If any fields are missing or unexpected fields are present, you will see a red dot and a list of the missing/extra fields. Please reach out to Expertise on Demand for additional assistance resolving this potential issue.