Creating and Using Base Searches
Data Watches usually rely on Indexes, Source Types, Sources, and Hosts to properly monitor data, but that can be limiting for some use cases. In some environments, admins may need to create custom searches that reference search time fields and utilize eval commands. While Atlas users can create Standalone Custom Data Watches to meet these needs in Monitor, with Base Searches, admins can leverage Atlas Monitor to not only track these unique data streams, but do so in an effective and reusable manner. With a Base Search, one search can populate multiple Data Watches, and can be split based on field values.
For example, using this functionality, an admin can monitor log-in data from multiple company subsidiaries by utilizing a Base Search that joins account fields lookup with an Active Directory lookup. Using this Base Search, the admin can then build multiple Data Watches for the many subsidiaries.
Creating Base Searches
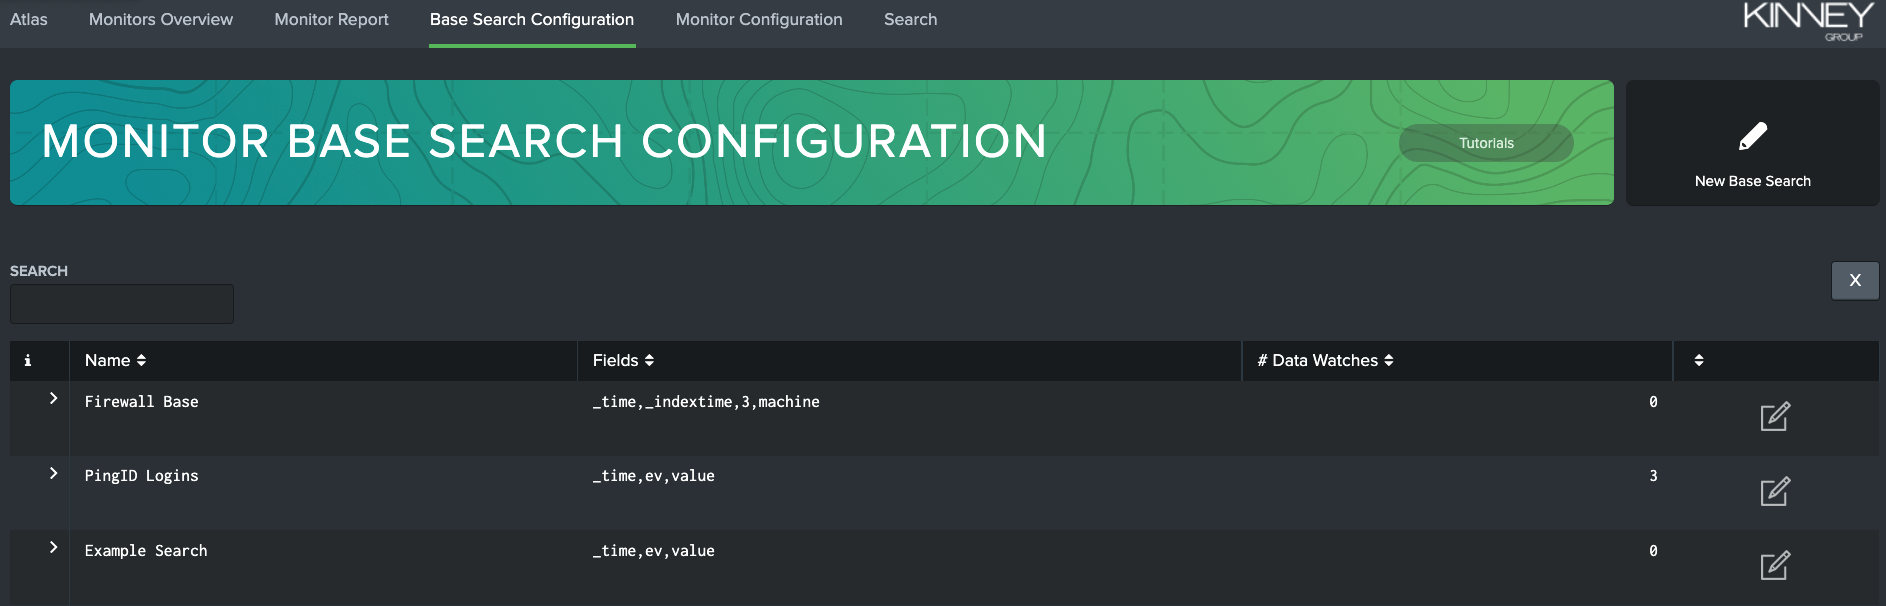
In order to create a Base Search, you must first navigate to the Base Search Configuration tab. Here you will find a list of the currently available Base Searches, which you can edit by clicking on the pencil-and-paper icon beside each search. If you have many Base Searches in your environment, you can filter the list with the search bar in the upper-left corner of the page.
Now, you can click the New Base Search button on the right-hand side of the banner. This brings up the "New Search" modal. This is the same modal that appears if you edit an existing Base Search, except the "New Search" text will be replaced with the name of the Base Search.
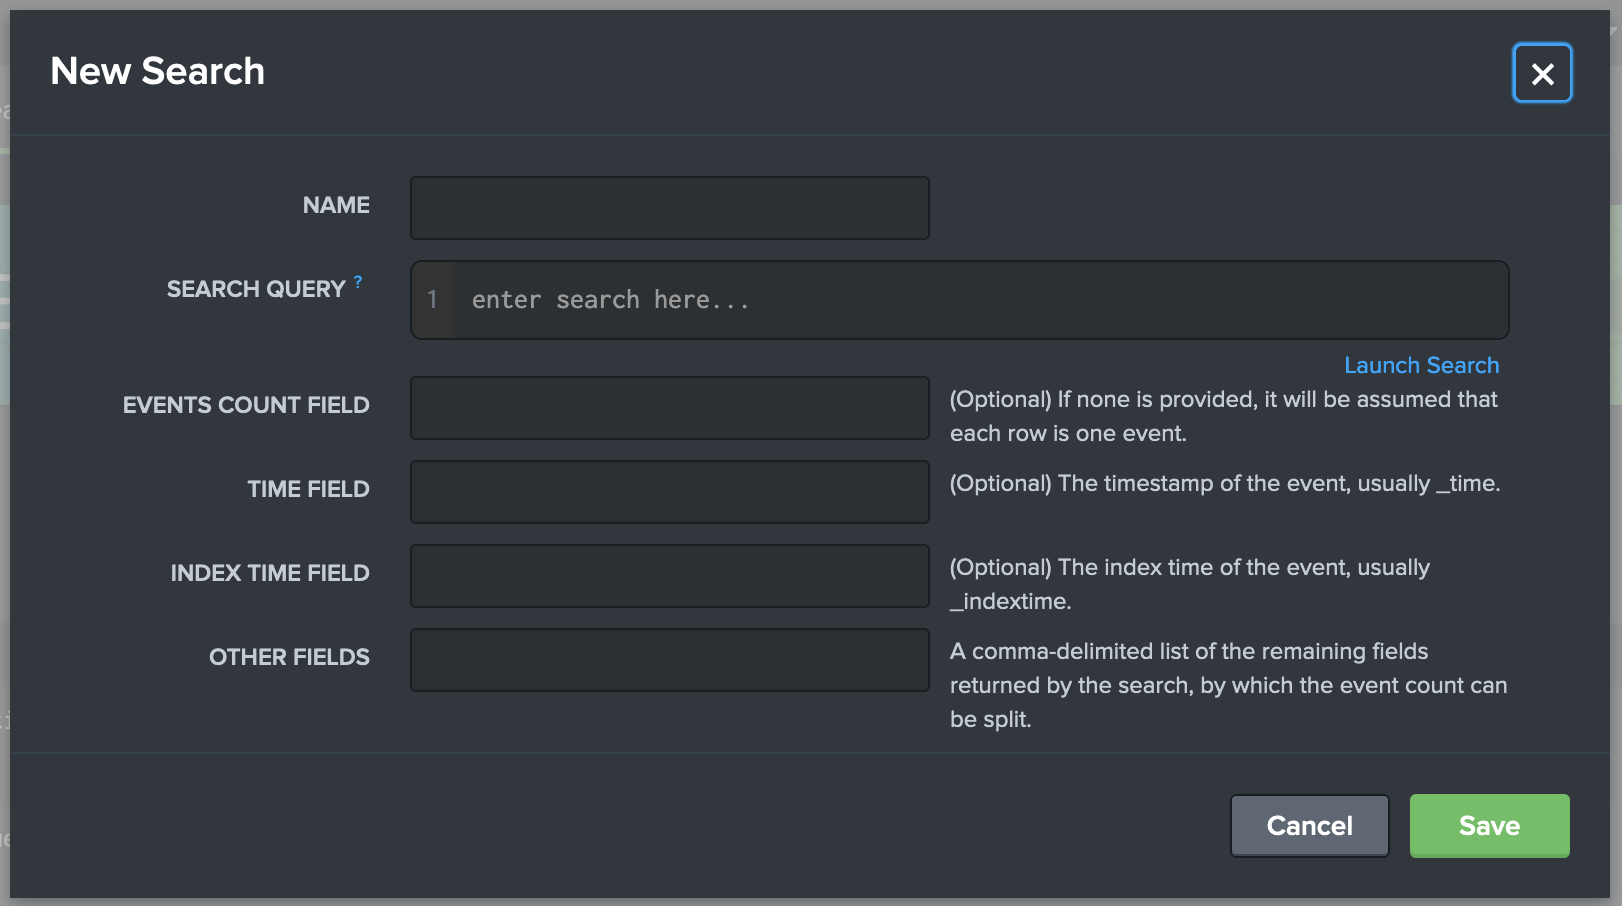
Next, fill in the fields provided in the modal as such (* indicates a required field):
Name*: desired name for your Base Search
Search Query*: the SPL that defines your Base Search
Your SPL Search needs to be started with a command such as '| search'.
It will also perform better if it ends in a transforming command such as '| stats'.
Events Count Field: a field that your SPL search returns that identifies the amount of events found
Time Field: the field that your SPL search returns that identifies time the event occurred
Index Time Field: the field that your SPL search returns that identifies the time the event was indexed
Other Fields: a list of the other fields returned by your SPL that can be split upon later in Custom Data Watches
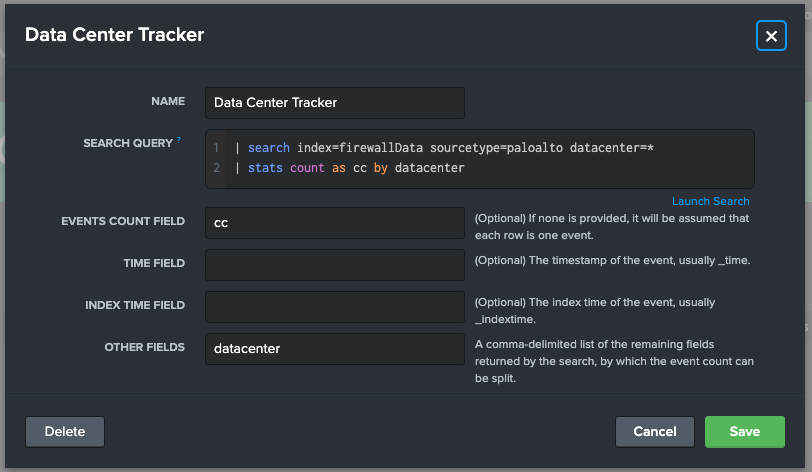
Here is an example of these fields filled out to create a test Base Search:
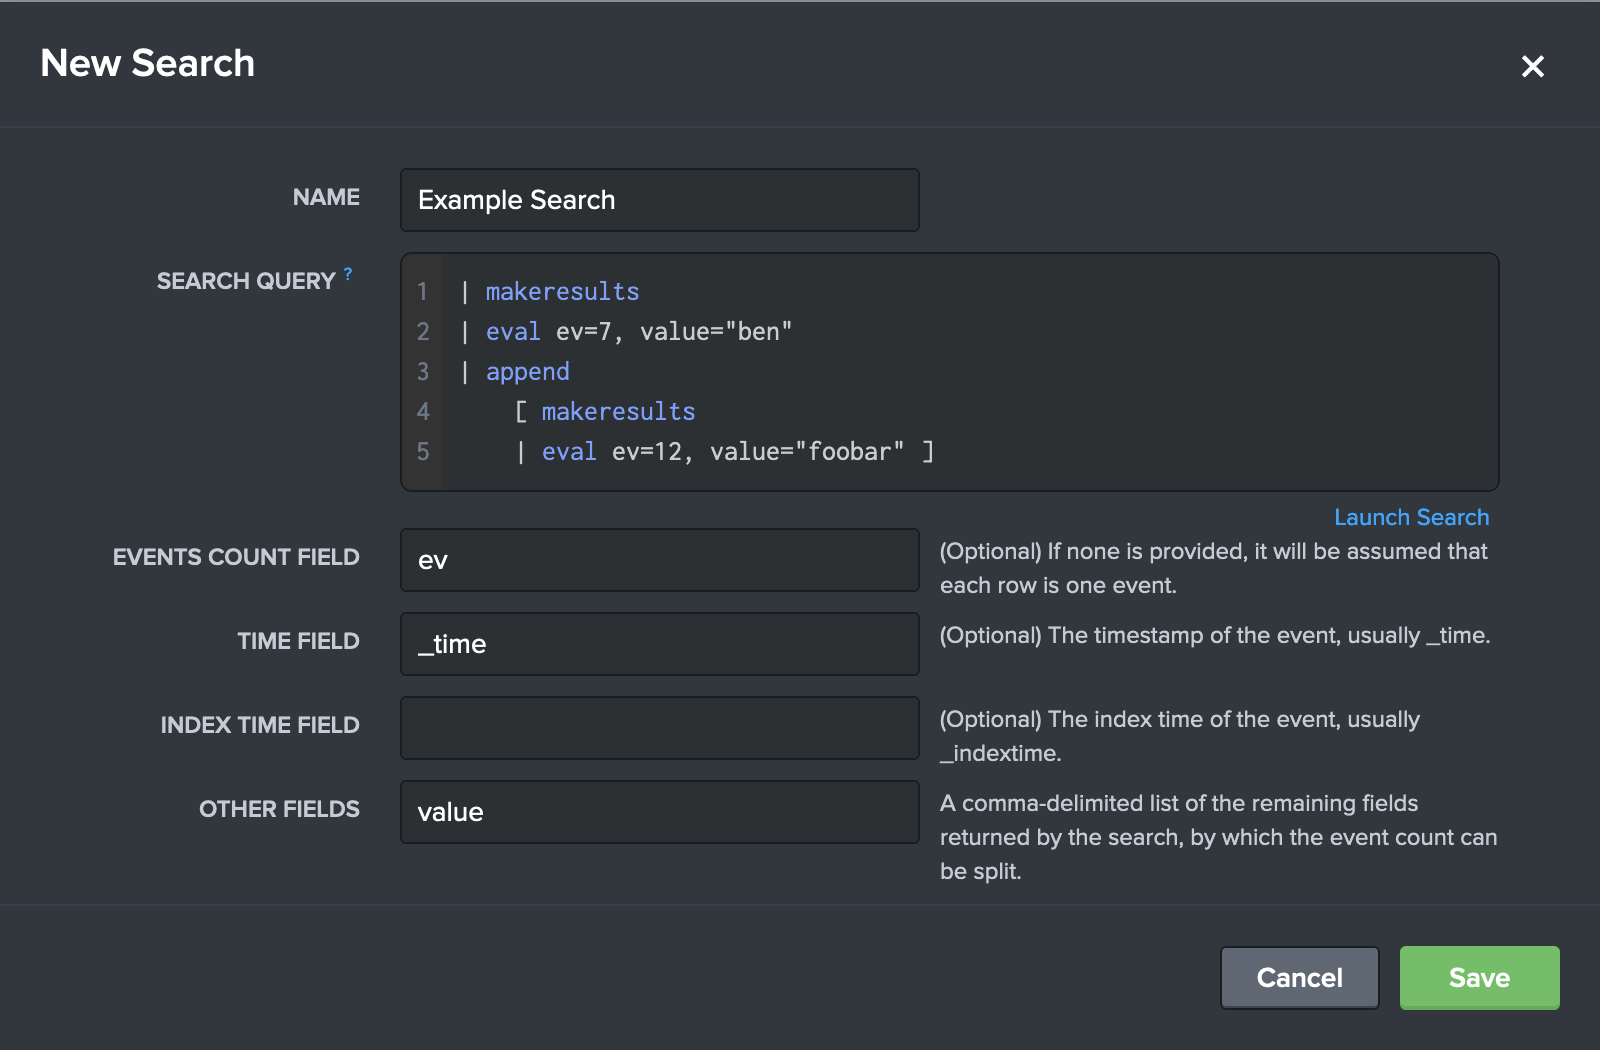
The new search now appears in the list of available Base Searches.
Creating Custom Data Watches with Base Searches
Your new Base Search can now be added to existing Monitor Groups! Simply navigate to the Monitor Report tab. Then, select an existing Monitor Group from the dropdown select on the left-hand side of the page. If you'd like to add your Base Search to a new Monitor Group, create it on the the Monitors Overview tab and then select it using the same method as above. Once you've selected the desired Monitor Group, click the Edit Monitor Group Name button in the top-right corner. This button brings up the Edit Monitor Group modal.
Within the modal, click "Add Custom Data Watch" in the bottom-right corner. This will now bring up the "Create Data Watch" modal. Your new Base Search can be selected from the Base Search dropdown select.
After selecting a Base Search, the admin can add new 'Split By' fields. This enables admins to split the original base search by any identified fields in the Other Fields configuration of Base Searches. Admins can add multiple fields that if any match will be counted for this Custom Data Watch.
You've now learned how to create Base Searches and add them to your Data Watches.
Data Watch Base Search Example
Jake needs to be the first person to know if one of the many data centers has stopped sending in firewall data. The firewall data coming in has a field that denotes it's origin, but unfortunately this is not an indexed field like index or host. Not to worry, Jake can still fulfill this alerting use case in Atlas Monitor using base searches, and it will be more efficient than building out numerous alerts for each data center.
First, Jake needs to create a base search that tracks the firewall index, and tracks events per data center. He navigates to Base Search Configuration page and creates a new Base Search.
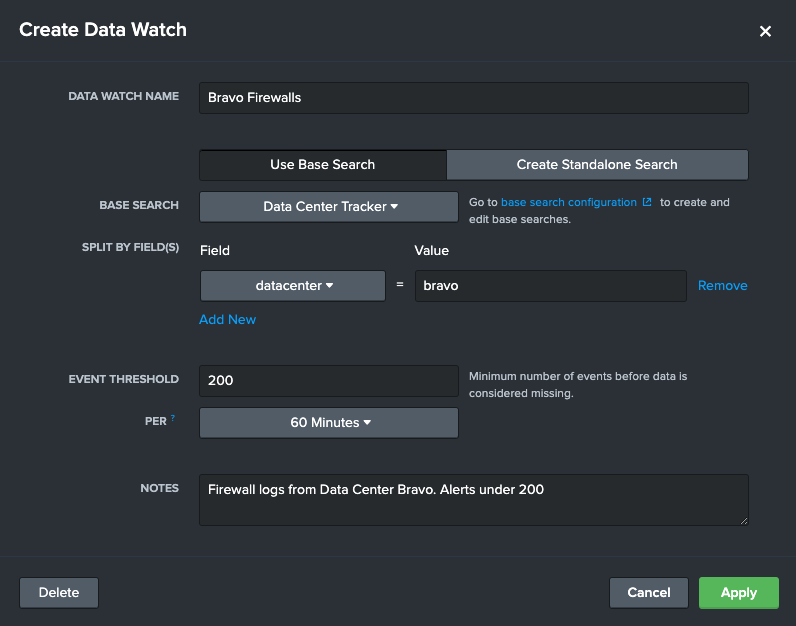
After hitting Save, Jake then navigates to the Monitoring Group belonging to Data Center Bravo. He wants to add a Custom Data Watch tracking firewall data from Data Center Bravo so he is alerted if this particular data center fails to send data to this index. Jake creates the a Custom Data Watch.
Jake now has a Custom Data Watch that alerts him if events from the firewall index, and more particularly from the Bravo Data Center, falls under 200 events an hour. Jake can now create more of these Custom Data Watches leveraging the same base search for other data centers.