Using Scheduling Assistant
The Scheduling Assistant Element gives users and admins visibility into their scheduled search issues like never before. Not only will the Scheduling Assistant give visuals to identify concurrency bottlenecks, it will also summarize this complex analysis into a Health Score and offer the tools to improve Splunk environments without needing to get into the weeds and perform intensive investigations.
Using Scheduling Assistant with Splunk Search Peers

Use this filter to select which Search Head, and the searches scheduled on them, the dashboard should use to populate its visualizations. The default selection 'localhost' will utilize the Search Head the user is currently on.
Scheduling Assistant Dashboard
Scheduled Searches Explorer
On the Scheduling Assistant dashboard, a user can both investigate Splunk's scheduler performance, and also triage poor performing searches. By selecting one of these searches in the Scheduled Search section, users can investigate the search further and also utilize Atlas's automation to test and improve the schedule of the search. Users can filter down the searches being investigated by name, app, and owner, by using the filters at the top of the dashboard. It is recommended to have a time span of at least 24 hours to get a proper analysis of the Scheduler.
Scheduler Historical Performance
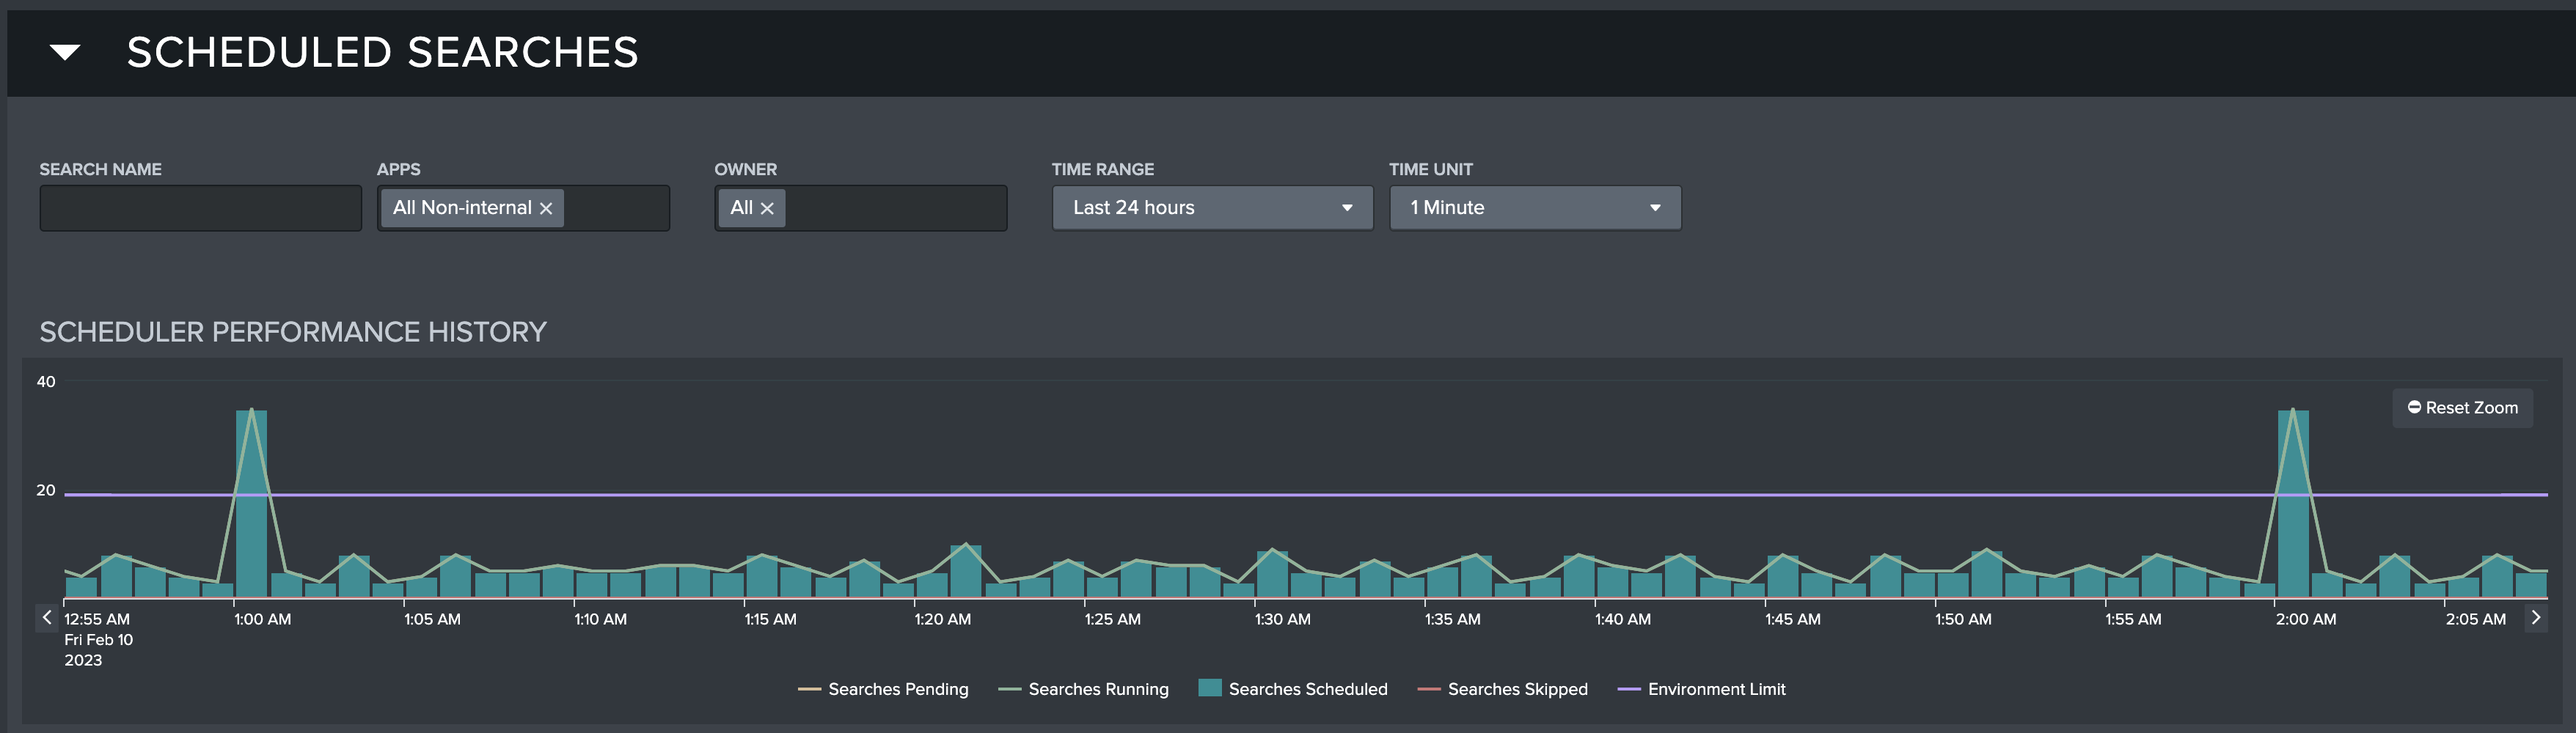
Scheduling Assistant starts with the Scheduler Historical Performance visualization. This time chart reveals key findings about the overall heart beat of the Splunk Scheduler. To change the time units of X-axis, select a new option in the Time Unit input. It is recommended to start with '1 Minute' in the Time Unit input. This time chart shows searches in multiple statuses, and can be selected to view the appropriate searches in the Scheduler Table. A time selection can be cleared by selecting the Clear Time Range button that appears under the time chart.
What searches can I see on the Scheduler Historical Performance chart and table?
Scheduler Historical Performance Legend and Search Statuses:
Environment Limit: This is the fixed value for amount of CPUs set aside to execute scheduled searches, based on environment configurations. If there are more searches scheduled than CPUs available, then Searches will be set to Pending
Searches Scheduled: This the amount of searches scheduled for that particular time bucket. Searches always start as scheduled, and then are labeled as either running, pending, or skipped
Searches Pending: These are the amount of scheduled searches that are queued up to execute when a CPU is made available. Scheduled searches that are pending for a long time period may be skipped
Searches Running: These are the amount of scheduled searches that are actively running at this time. If it is an intensive search, searches can be identified as running for multiple minutes
Searches Skipped: This is the amount of scheduled searches that failed to execute and were skipped at this time. Searches can go from being labeled scheduled, then pending, then skipped over the course of multiple minutes
This is a powerful, advanced view of the heart beat of your Splunk's scheduler. Beginner users can skip over this visual and focus on the triage values in the Investigation table, but eventually these findings should be analyzed.
Users should investigate periods of high scheduled and skipped searches and then identify what searches can be rescheduled to more empty time periods. Users can also find long tails of pending or running searches to narrow down potential bad practice searches.
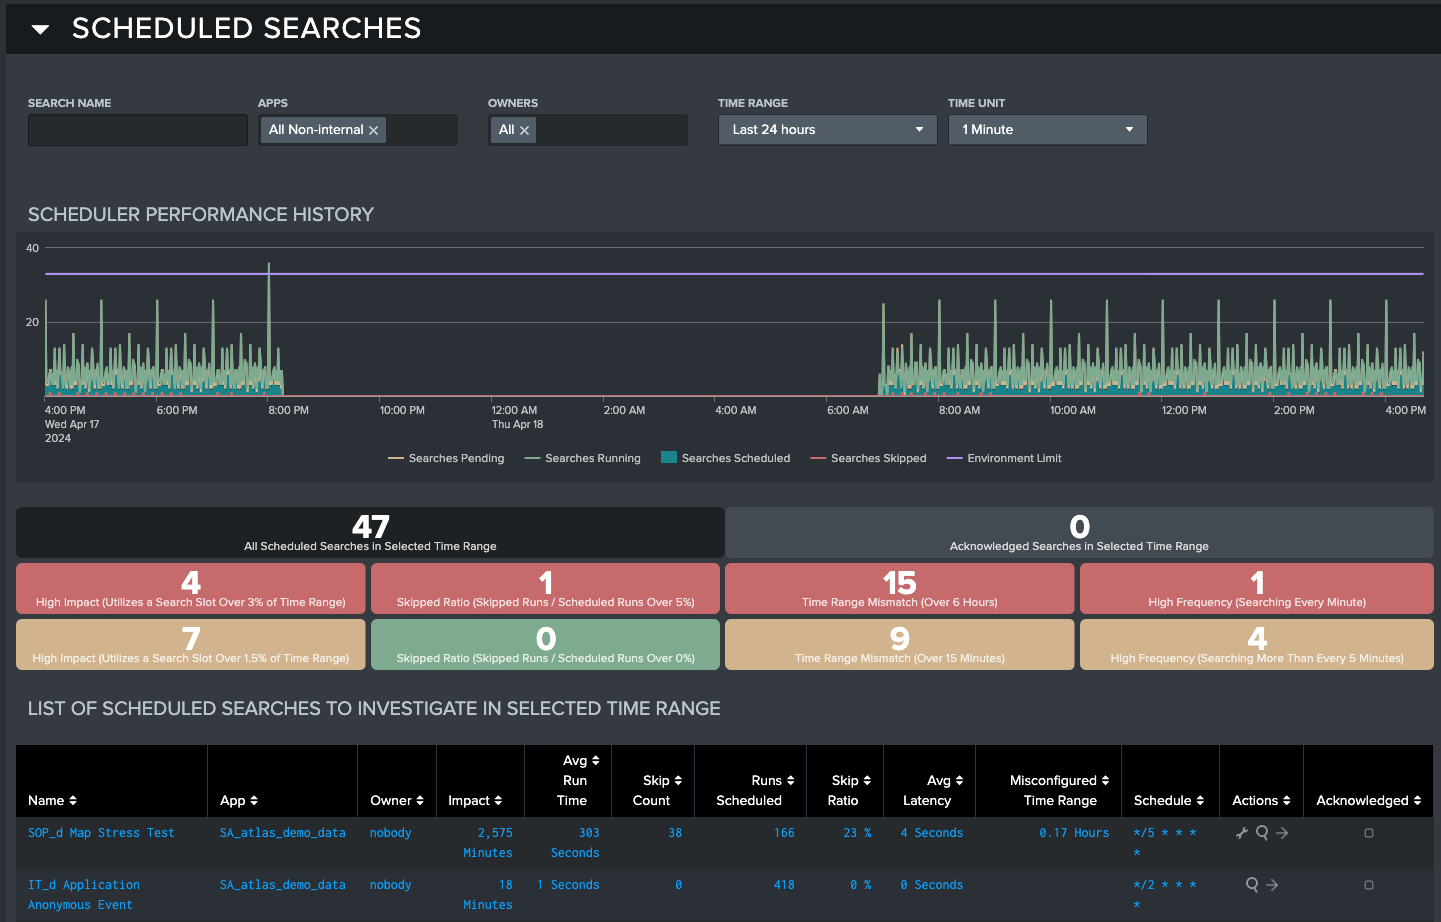
Scheduled Search Investigation Table
The Search Investigation Table is preceded by scheduled search triage KPIs. These values track the amount of searches found from the dashboard filters that fall under certain criteria. There exists a 'High Priority' row with higher, critical thresholds, and then below it a 'Moderate Priority' row with lower thresholds. Selecting one of these values will filter down the Investigation table to those appropriate searches. Selecting the 'All Scheduled Searches' box will reset it back to default view.
The triage filters are defined as:
Impact: These searches utilize an abnormal amount of CPU time. Scheduled searches with high CPU utilization rates should be reviewed for efficient search SPL and configurations
Skip Ratio: These searches skip a notable amount of their scheduled runs. Scheduled searches with high skip rates should be moved to more open schedules, or reviewed for efficient search configurations
Time Range Mismatch: These searches have large differences between the time range and the schedule of execution. Both searches that have gaps and overlap are contained in this range.
Frequency: These searches execute many times an hour. Scheduled searches rarely need to execute more than once every five minutes and those that do should have their schedule reviewed
Selecting a search on the Scheduled Search Investigation Table will open up the search in the Investigation section and give users the ability to test and reschedule the search. Users can also click on the buttons in the Action Column to be directed to the Search in Splunk's Searches and Reporting report, or open and run the search in the Splunk Search window. The wrench icon in the table's Action column appears for any search with a time range mismatch. Selecting this button will open a modal outlining the suggested changes and enable the user to apply them at a click of a button.
Acknowledge Searches
Users can select searches in using the checkbox in the Acknowledge column of the Investigation Table. Users can save these changes by selecting the Acknowledge button that appears above the table. Acknowledged searches are not counted in the calculations for the triage KPIs. This enables users to 'ignore' searches that may be identified by Atlas's thresholds, but are necessary for meeting outcomes in Splunk. Acknowledged searches still appear in the Scheduler Performance History time chart, and can be viewed at any time by selecting the 'Acknowledged Searches in Selected Time Range' value.
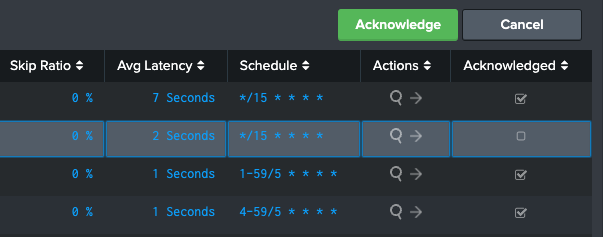
To unacknowledged a search, simply click a checkmark in the Acknowledge column to deselect it, and select the Acknowledge button to update the list of acknowledged searches.
Investigation Section
This section focuses on the search selected in the Scheduled Search Investigation Table. Users can change the selection by scrolling up and selecting another search.
Test and Apply New Schedule
This is an advanced tool for testing and applying new schedules to Splunk searches. Schedules are written in cron and users can utilize the built in Cron Helper dashboard to learn and test new schedules. Pressing the Propose Schedule button lets Atlas investigate and test a new schedule through automation, saving time. Users can also manually input a valid cron schedule into the Cron Schedule text box and click Submit Preview. This tool will utilize historical data to compare how this new schedule will perform against the current schedule. To ensure best results, ensure the Time Range on the dashboard is above 24 hours.
If a cron schedule preview meets the user's satisfaction, then the user can select the Save Changes button to apply the schedule to the search.
What permissions are recommended for testing and applying new schedules to searches?
The tool will give updated findings to these results:
Scheduled Runs: This is the amount of search executions the new schedule will have. If this experiences change with the new schedule, its important to update the search's time range
Concurrent Schedulings: This is the amount of neighboring searches the current search experiences. For instance, if a search runs 10 times a day, and has 30 concurrent schedulings, then it runs 'next to' 3 other searches on average each time. Reducing this number means the search is competing less for resources
Average Concurrency: This is the average amount of neighboring searches the current search experiences. For instance, if a search runs 10 times a day, and has 50 concurrent schedulings, then it runs 'next to' 5 other searches on average each time. Reducing this number means the search is competing less for resources
Limit Breach Ratio: This is the rate that the search is scheduled on to run on time periods that break environment limits. Reducing this number by scheduling the search in more empty time slots ensures that scheduled searches have the least amount of chance of skipping or causing other searches to skip as well
Search Information
The following visualizations go over additional details related to the selected search. The search configuration settings and search statistics are displayed in table format, next to a box that contains the SPL of the selected Searched. Above the SPL box are three buttons. The Launch Search and View Search buttons behave like their counterparts in the Investigation Table. The Disable Search button will disable the search if its currently enabled.
The Scheduler Performance chart is present, but this time it only focuses on the selected search. This is useful to identify more micro-level trends related to search performance. If any skips have been recorded in the Time Range, the Skips Reasons table will appear to list all found reasons.
Autobalance Search Scheduler
The Autobalancer is a powerful tool that automates tedious administrative work involved in stabilizing search schedules. It reviews selected scheduled searches and provides bulk recommendations for optimized scheduling. With a single button click, you can apply these recommendations, saving hours of manual investigation and implementation.
The Autobalancer is particularly beneficial for on-premise Splunk environments, helping to reduce skipped search errors and improve CPU utilization.
Key Behavior
The Autobalancer does not alter the search duration (e.g., changing a 5-minute search to a 15-minute search). Instead, it adjusts the timing of scheduled searches.
For example, a search originally running at the first minute of the hour might be shifted to the third minute of the hour.
Executing the Autobalancer
On page load, the Autobalancer page will display two visualizations:
- A time chart showing search time peaks in your current scheduler.
- A table listing all searches found in the environment with their current schedules.
The following steps outline how to use the tool:
Review the list of scheduled searches and select all searches you want to reschedule.
- Use the Select All button at the top right of the table for bulk selection.
- Exclude searches that rely on exact execution timing.
After selecting the desired searches, click Launch.
- This will not change the searches immediately. It will only initiate the Autobalancer investigation.
The Recommended Scheduler Projection visualization will load, showing the estimated schedule after the Autobalancer is applied.
- Review the table of recommended changes.
- Searches can be de-selected, and the Autobalancer can be re-calculated to update findings.
Click the Launch button again to apply the Autobalancer recommendations.
- Atlas will begin rescheduling the selected searches.
Track scheduler activity in the Scheduling Assistant to monitor how your environment responds.
Reverting Previous Autobalancer
If your Splunk scheduler is experiencing unintended results after running the Autobalancer, Atlas provides a Revert button to restore the previous schedules.
- The Revert button will appear on the Autobalancer page if a previous Autobalancer run has been detected.
- This action will revert the last Autobalancer execution.
Important: Running the Autobalancer multiple times in a row will overwrite previous schedules. This means you will lose the ability to revert to the original schedules after subsequent runs.
Scheduler Activity Dashboard
Scheduler Health Snapshot
The Scheduler Activity dashboard is a great starting point for understanding where Splunk environment is with regards to Concurrency. At the top of the dashboard is the Scheduler Health Snapshot, which shows the Splunk environment's Health Score and some other Key Performance Indicators (KPIs) that feed into the score. The Health Score is designed to identify areas where your searches are not operating at peak performance and make sure those issues are visible. It performs an analysis on the environment and then will report on a scale of 1 to 8 on how well the environment is handling and scheduling searches. Users can expand the health score to look at future schedulings in the environment by starting a Concurrency Investigation. To learn more about how the score is calculated, look at the ‘How is the Health Score Calculated’ help text. Managing Concurrency is important in Splunk environment. Bad management can lead to skipped searches, where critical alerts or dashboard populating searches fail to operate. Concurrency can also impact performance of general usability of Splunk, with users noticing slower search results and being placed in queues.
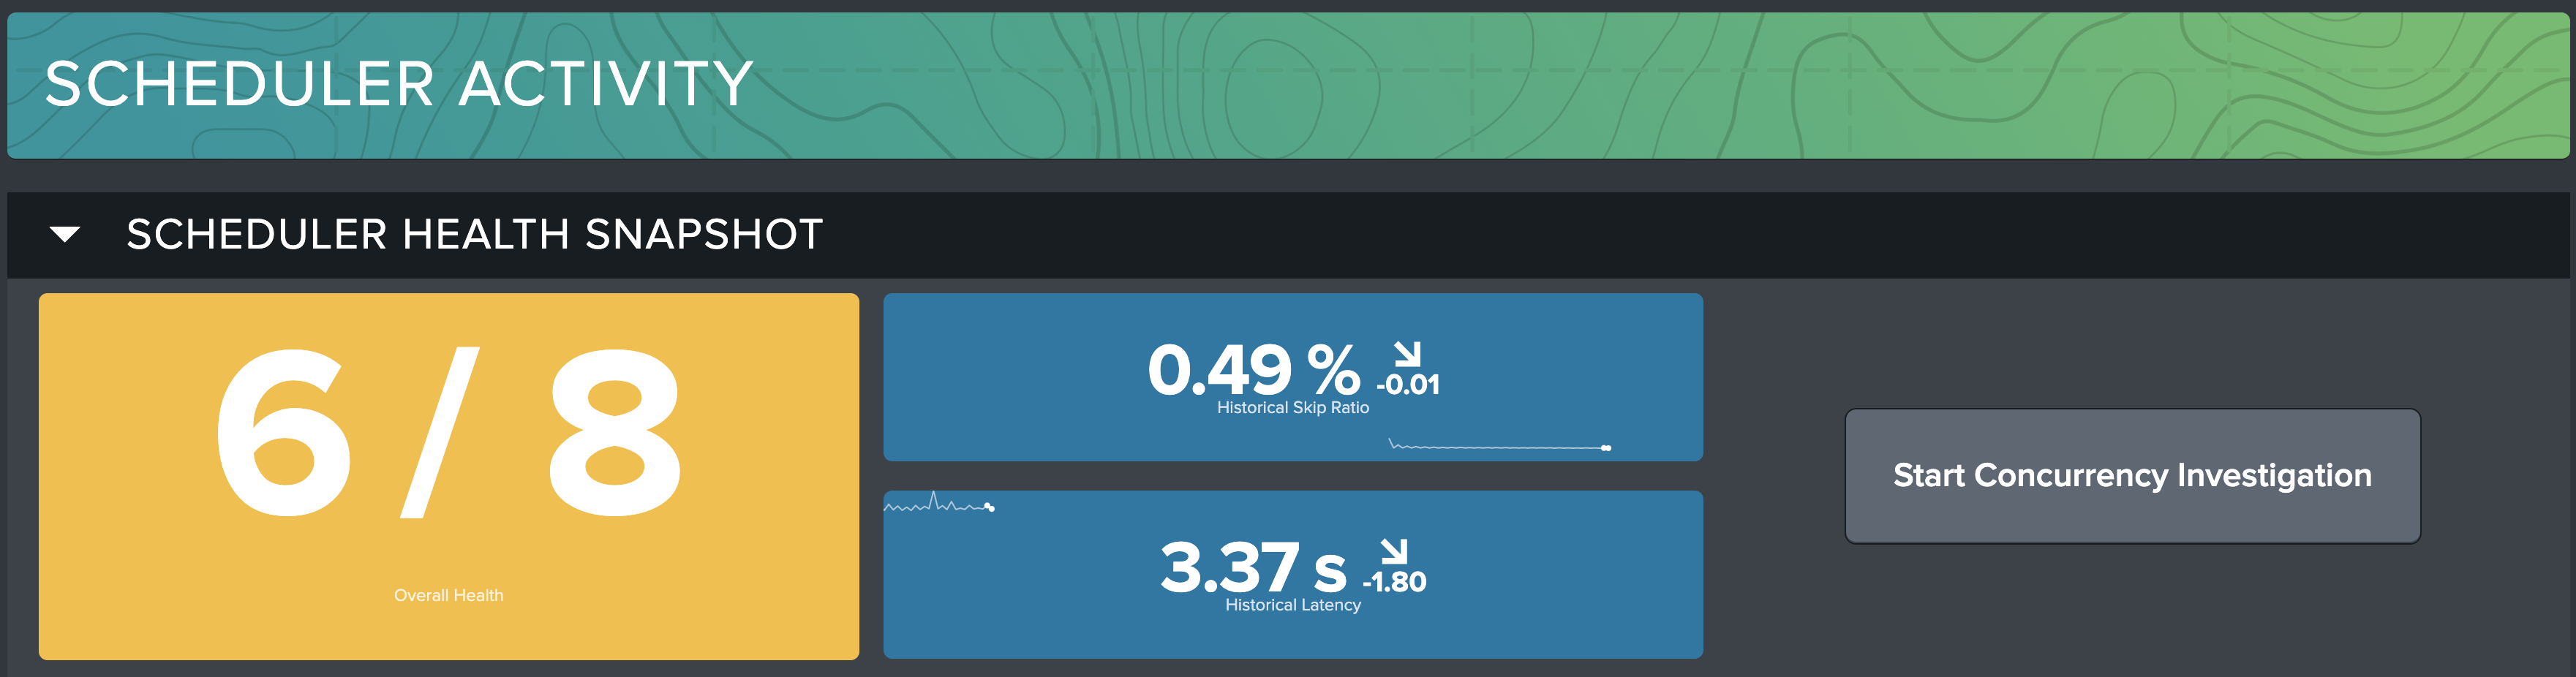
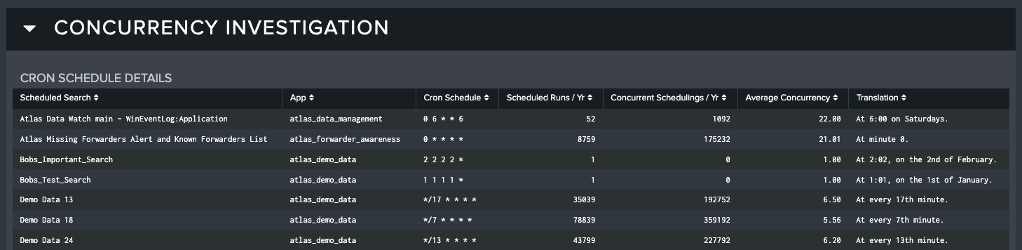
Concurrency Investigation
Clicking on the Start Concurrency Investigation button on the Health Snapshot will bring up a modal that will launch the Concurrency Investigation. After the Investigation finishes, the Concurrency Investigation section will populate. Using the filters at the top of the view, Admins can narrow down and investigate problematic searches and schedules. This table also shows the Cron schedule (and a useful translation for those with less Cron experience) associated with each Scheduled Search along with how much that search overlaps with other searches. Users can find searches with high concurrent schedulings in the table, or searches scheduled for bottlenecks in the 'Historical Searches Scheduled in Time Range' time chart and then with a simple click be directed to the Scheduling Assistant dashboard with the search preselected.
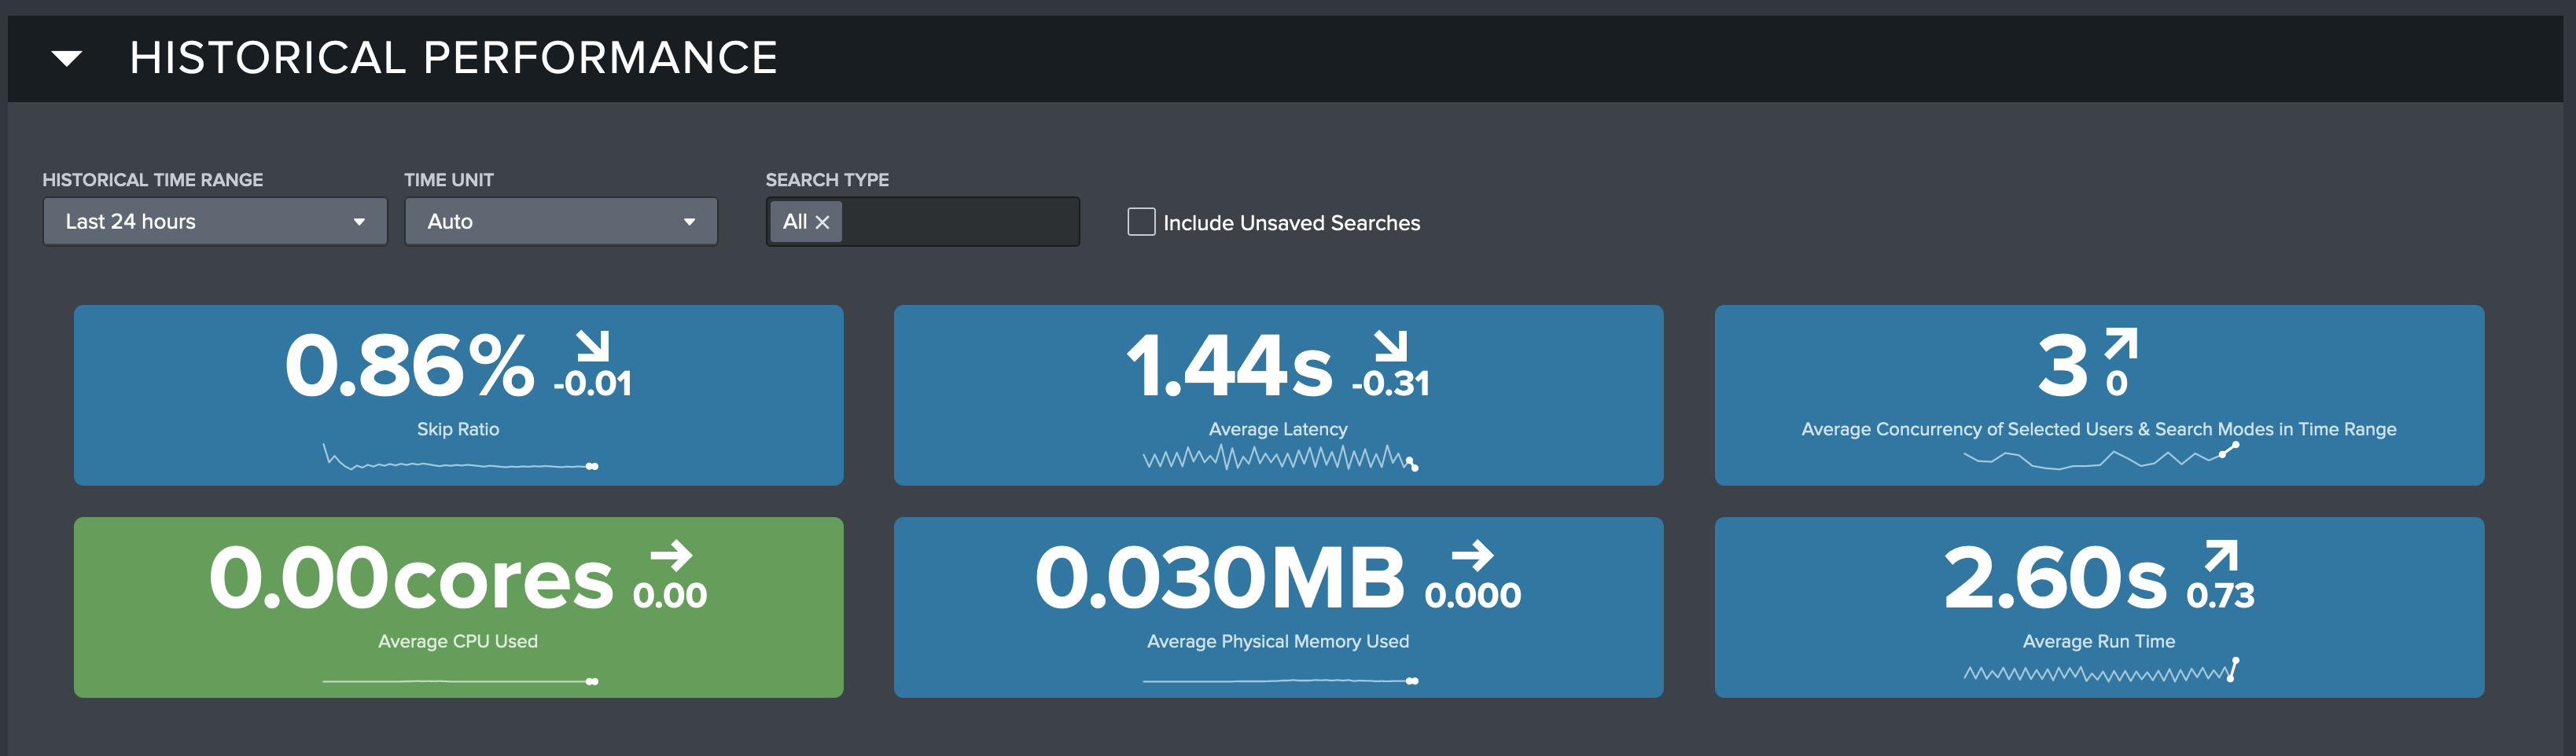
Historical Performance
The Scheduling Activity Dashboard also contains information on your environment's Historical Performance. Several KPIs at the top of this view give Admins quick access to information about resource usage, average latency, average run time, and more. These KPIs can also be tuned to a desired time range, should the Admin need information on a longer time scale. This table can also be exported as in Concurrency Investigation.
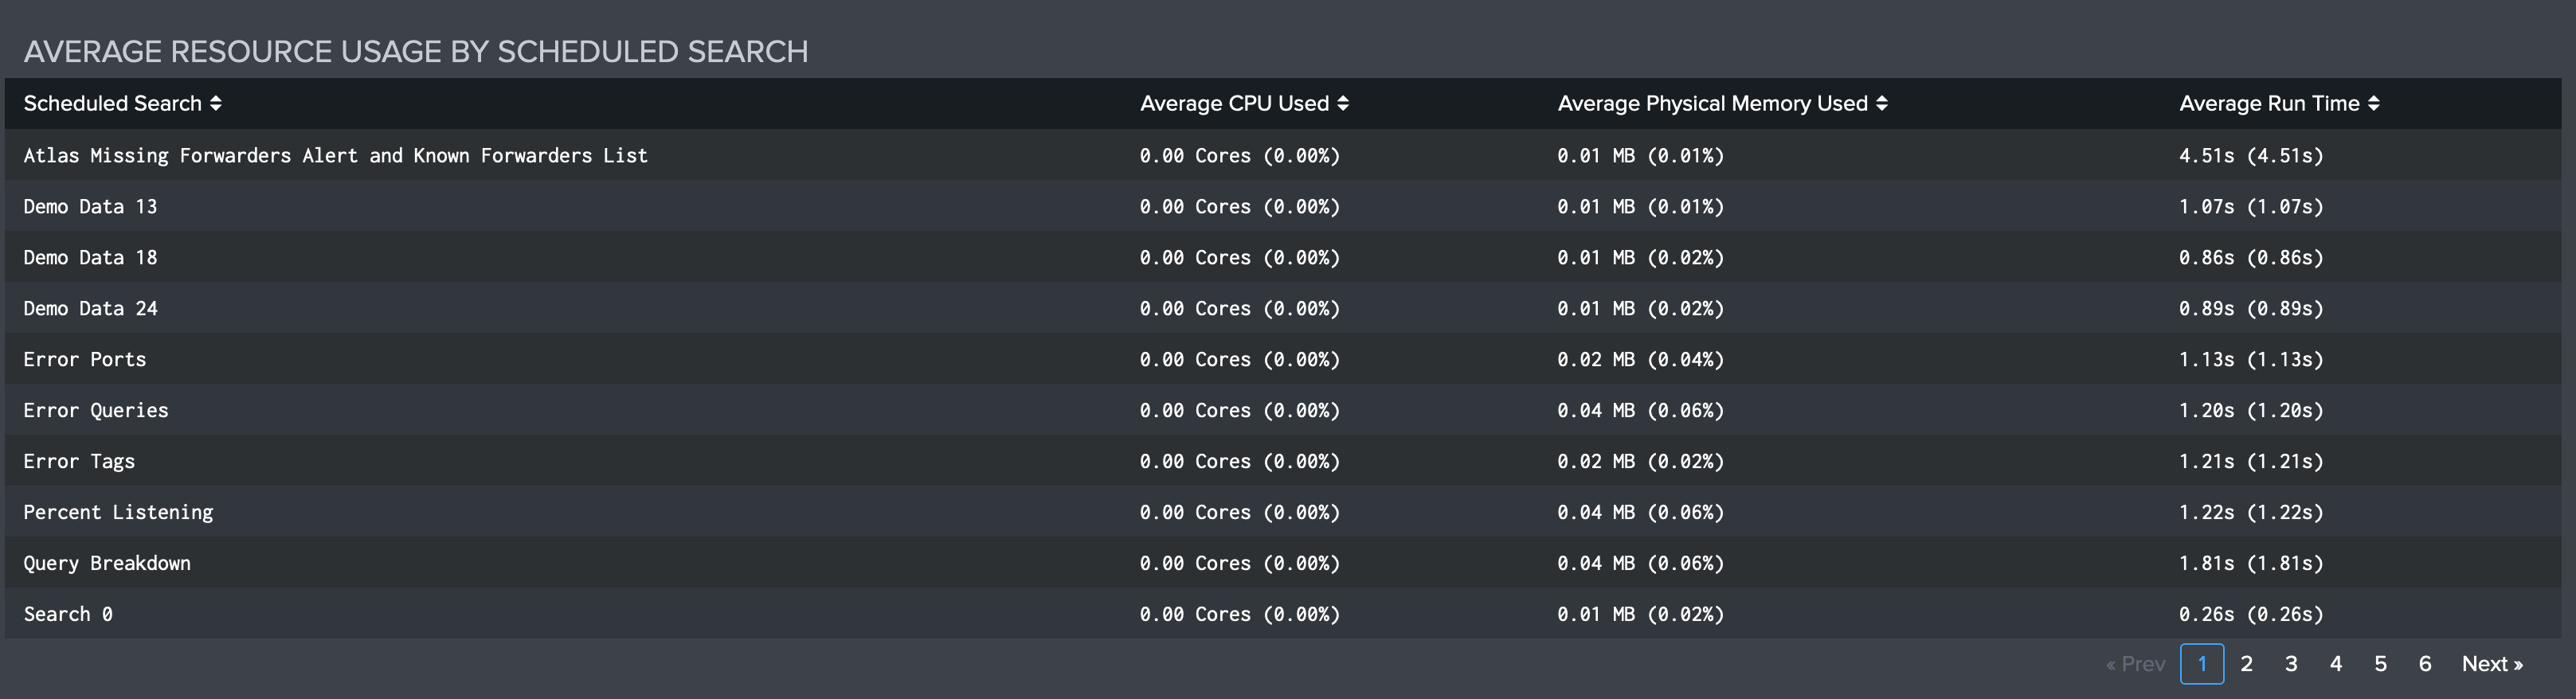
Below the KPIs is a table breaking down each search's performance by CPU usage, memory usage, and average run time.
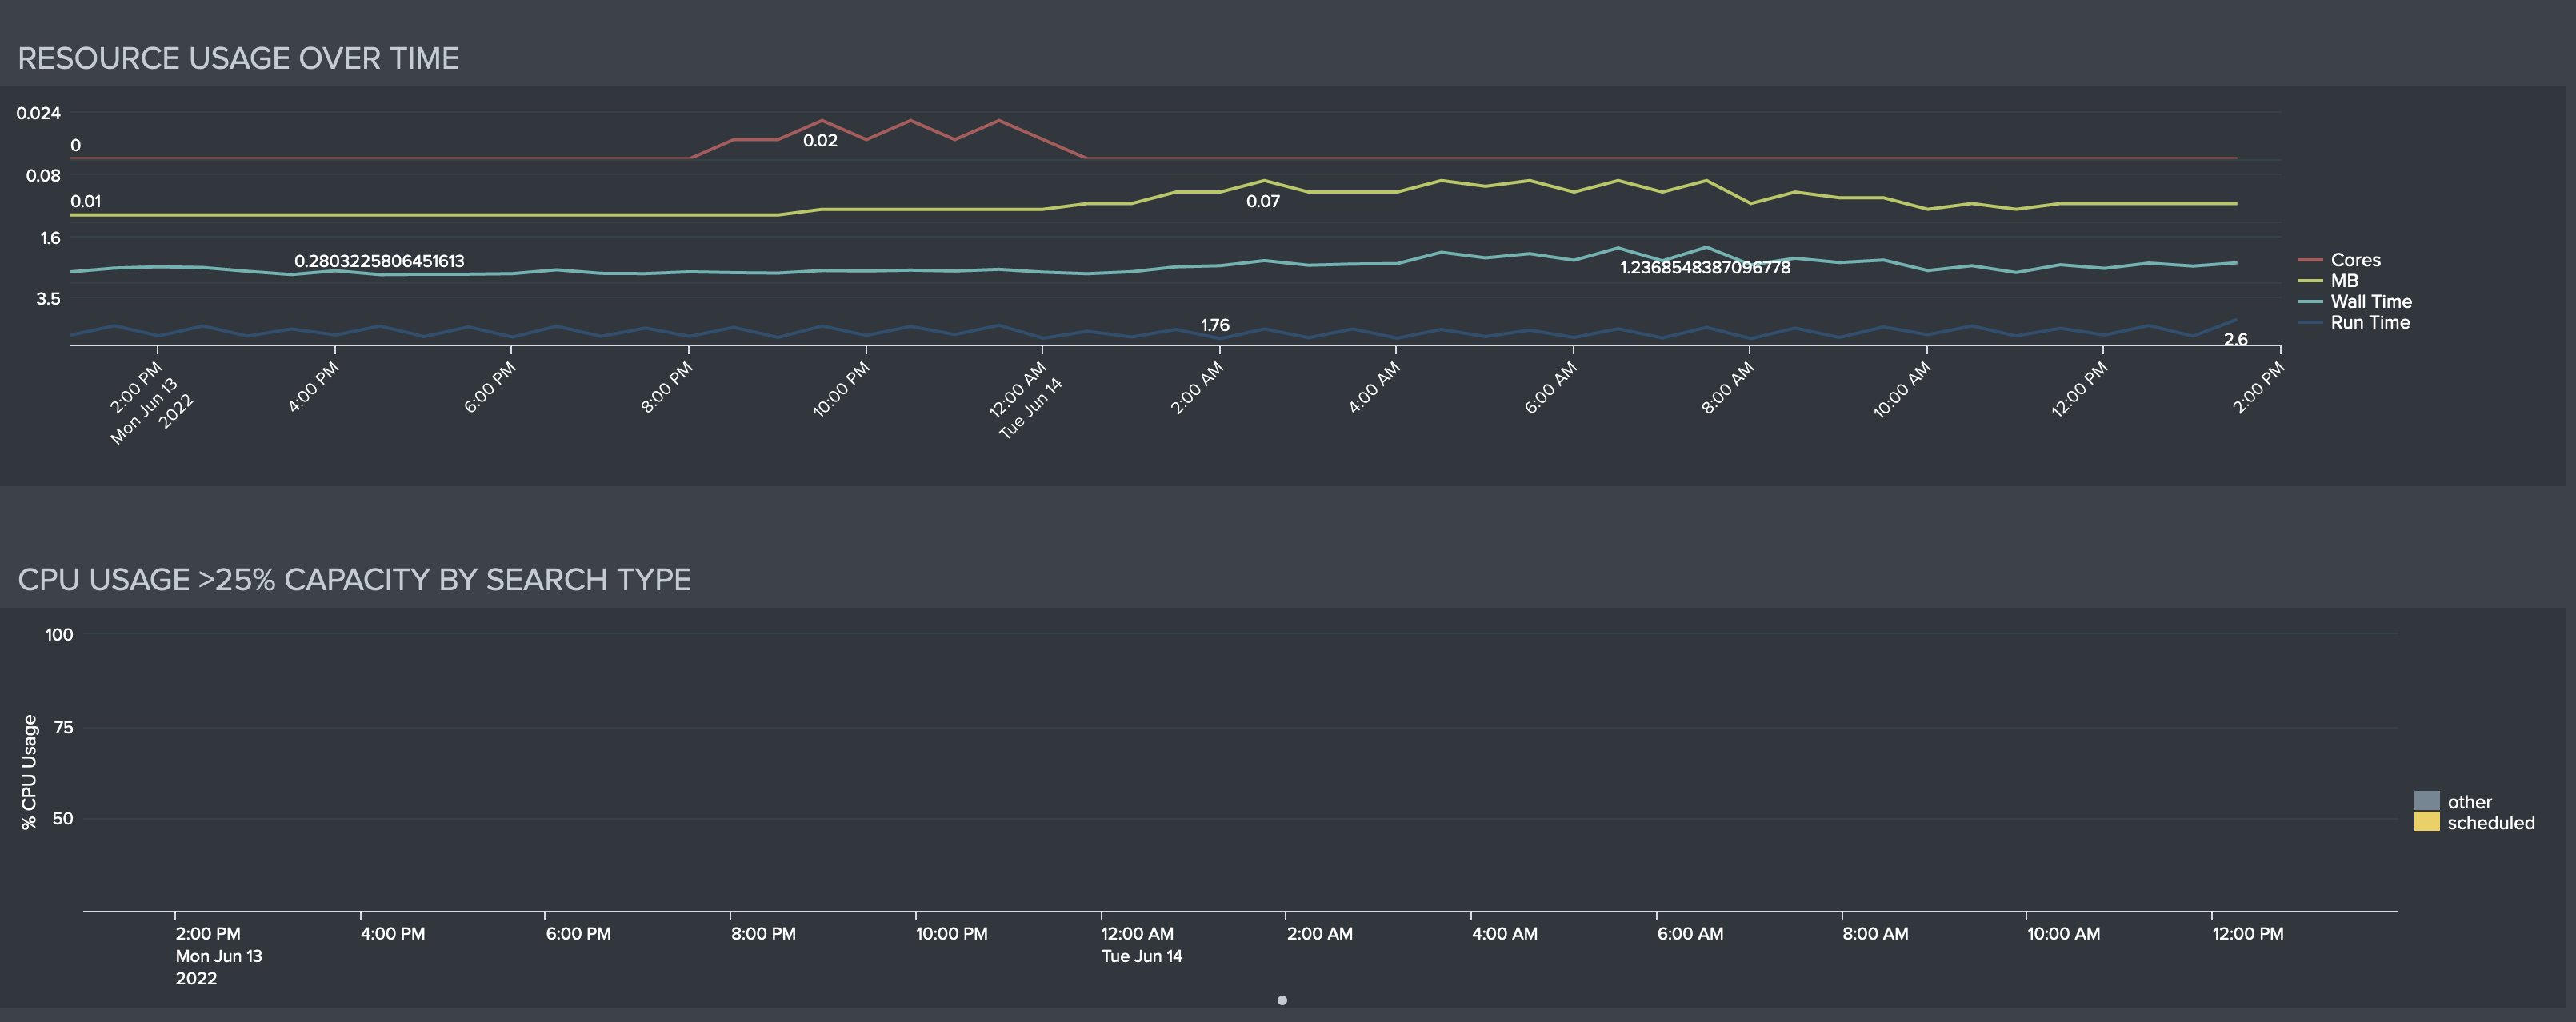
The Historical Performance view also contains some charts to display overall resource usage statistics and CPU usage statistics specifically.
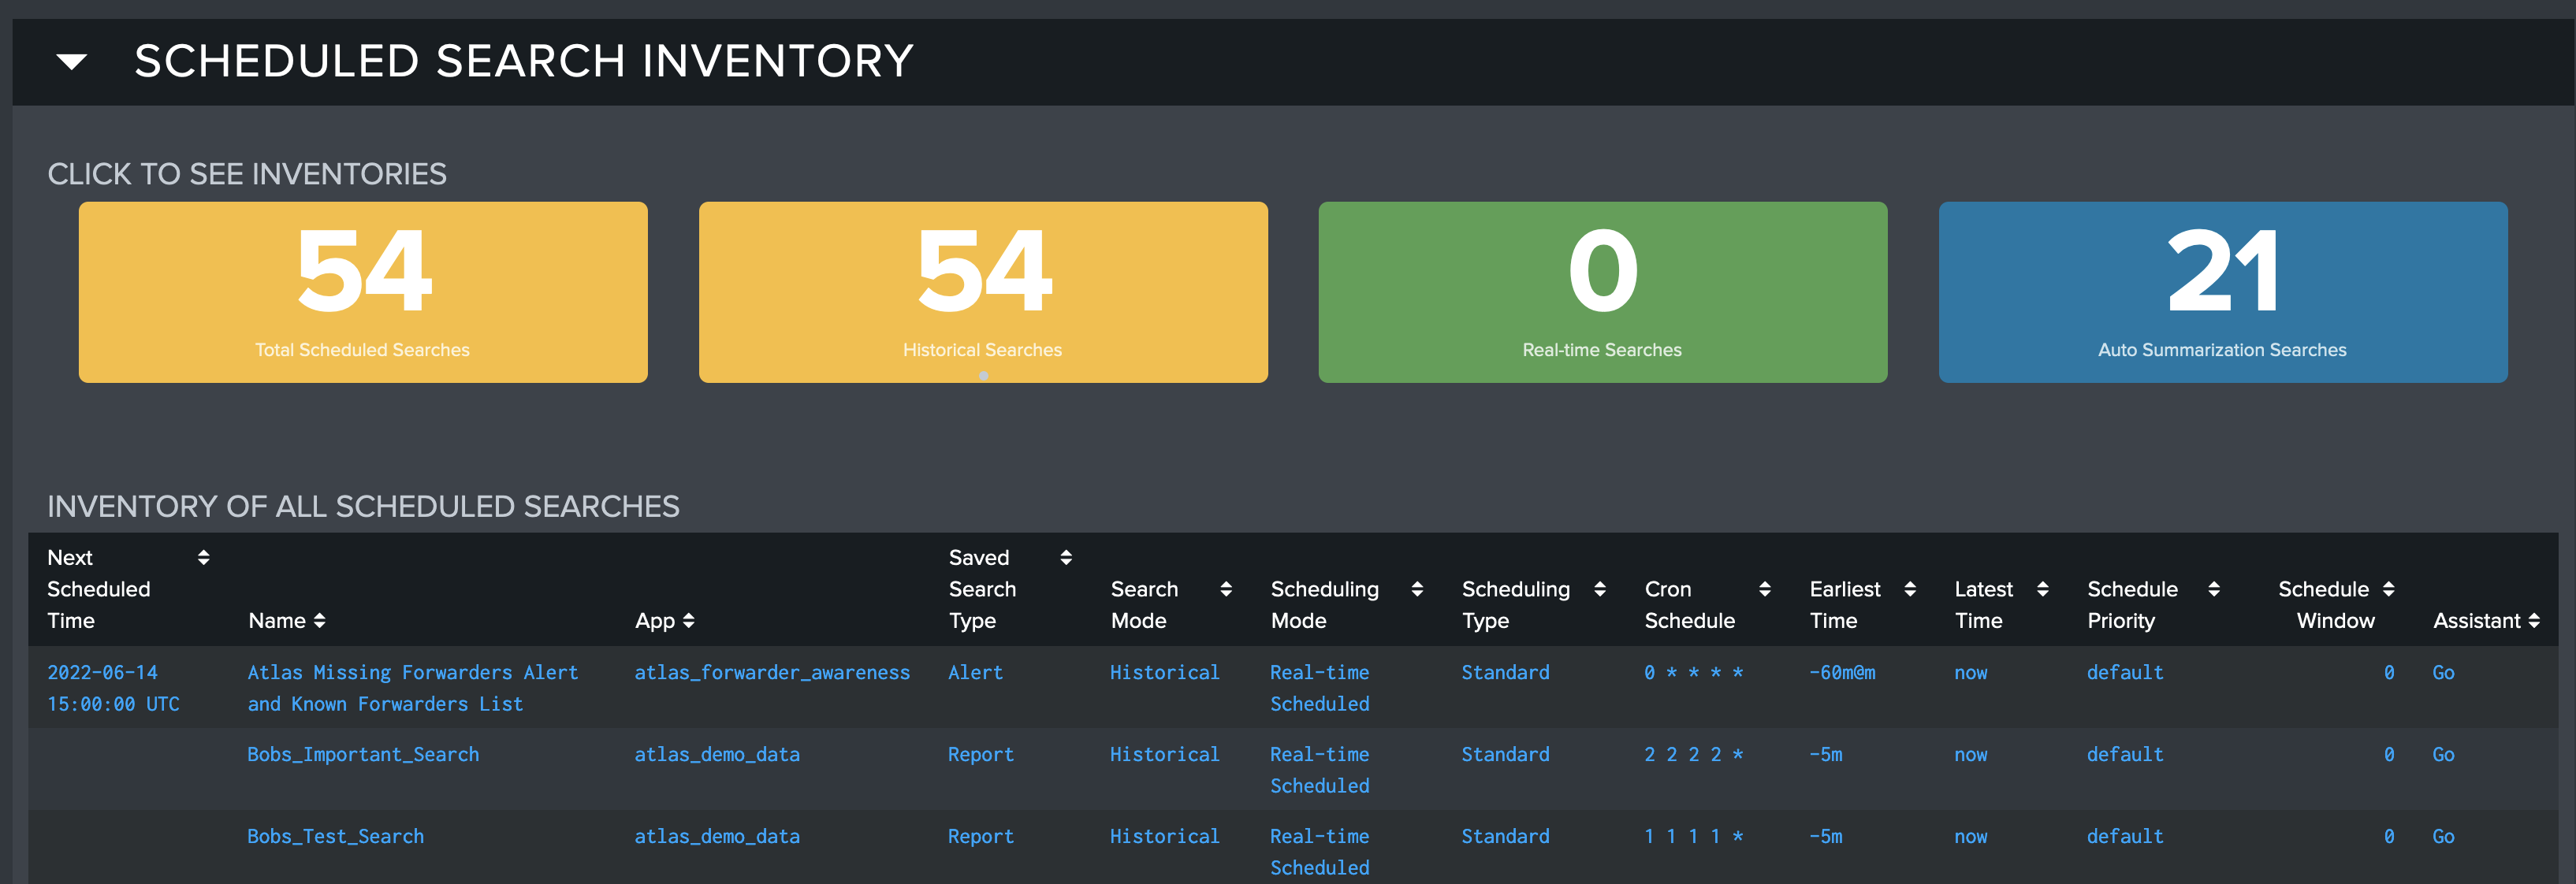
Scheduled Search Inventory
Finally, at the bottom of the Scheduler Activity dashboard, is the Scheduled Search Inventory. This view has a few KPIs indicating the number of various types of searches in your environment. Clicking on any of these KPIs will expand a corresponding table with more information about each search in that category. Clicking the "Go" at the right of each entry opens that search in the Scheduling Assistant dashboard. This table can also be exported as in Concurrency Investigation and Historical Performance.
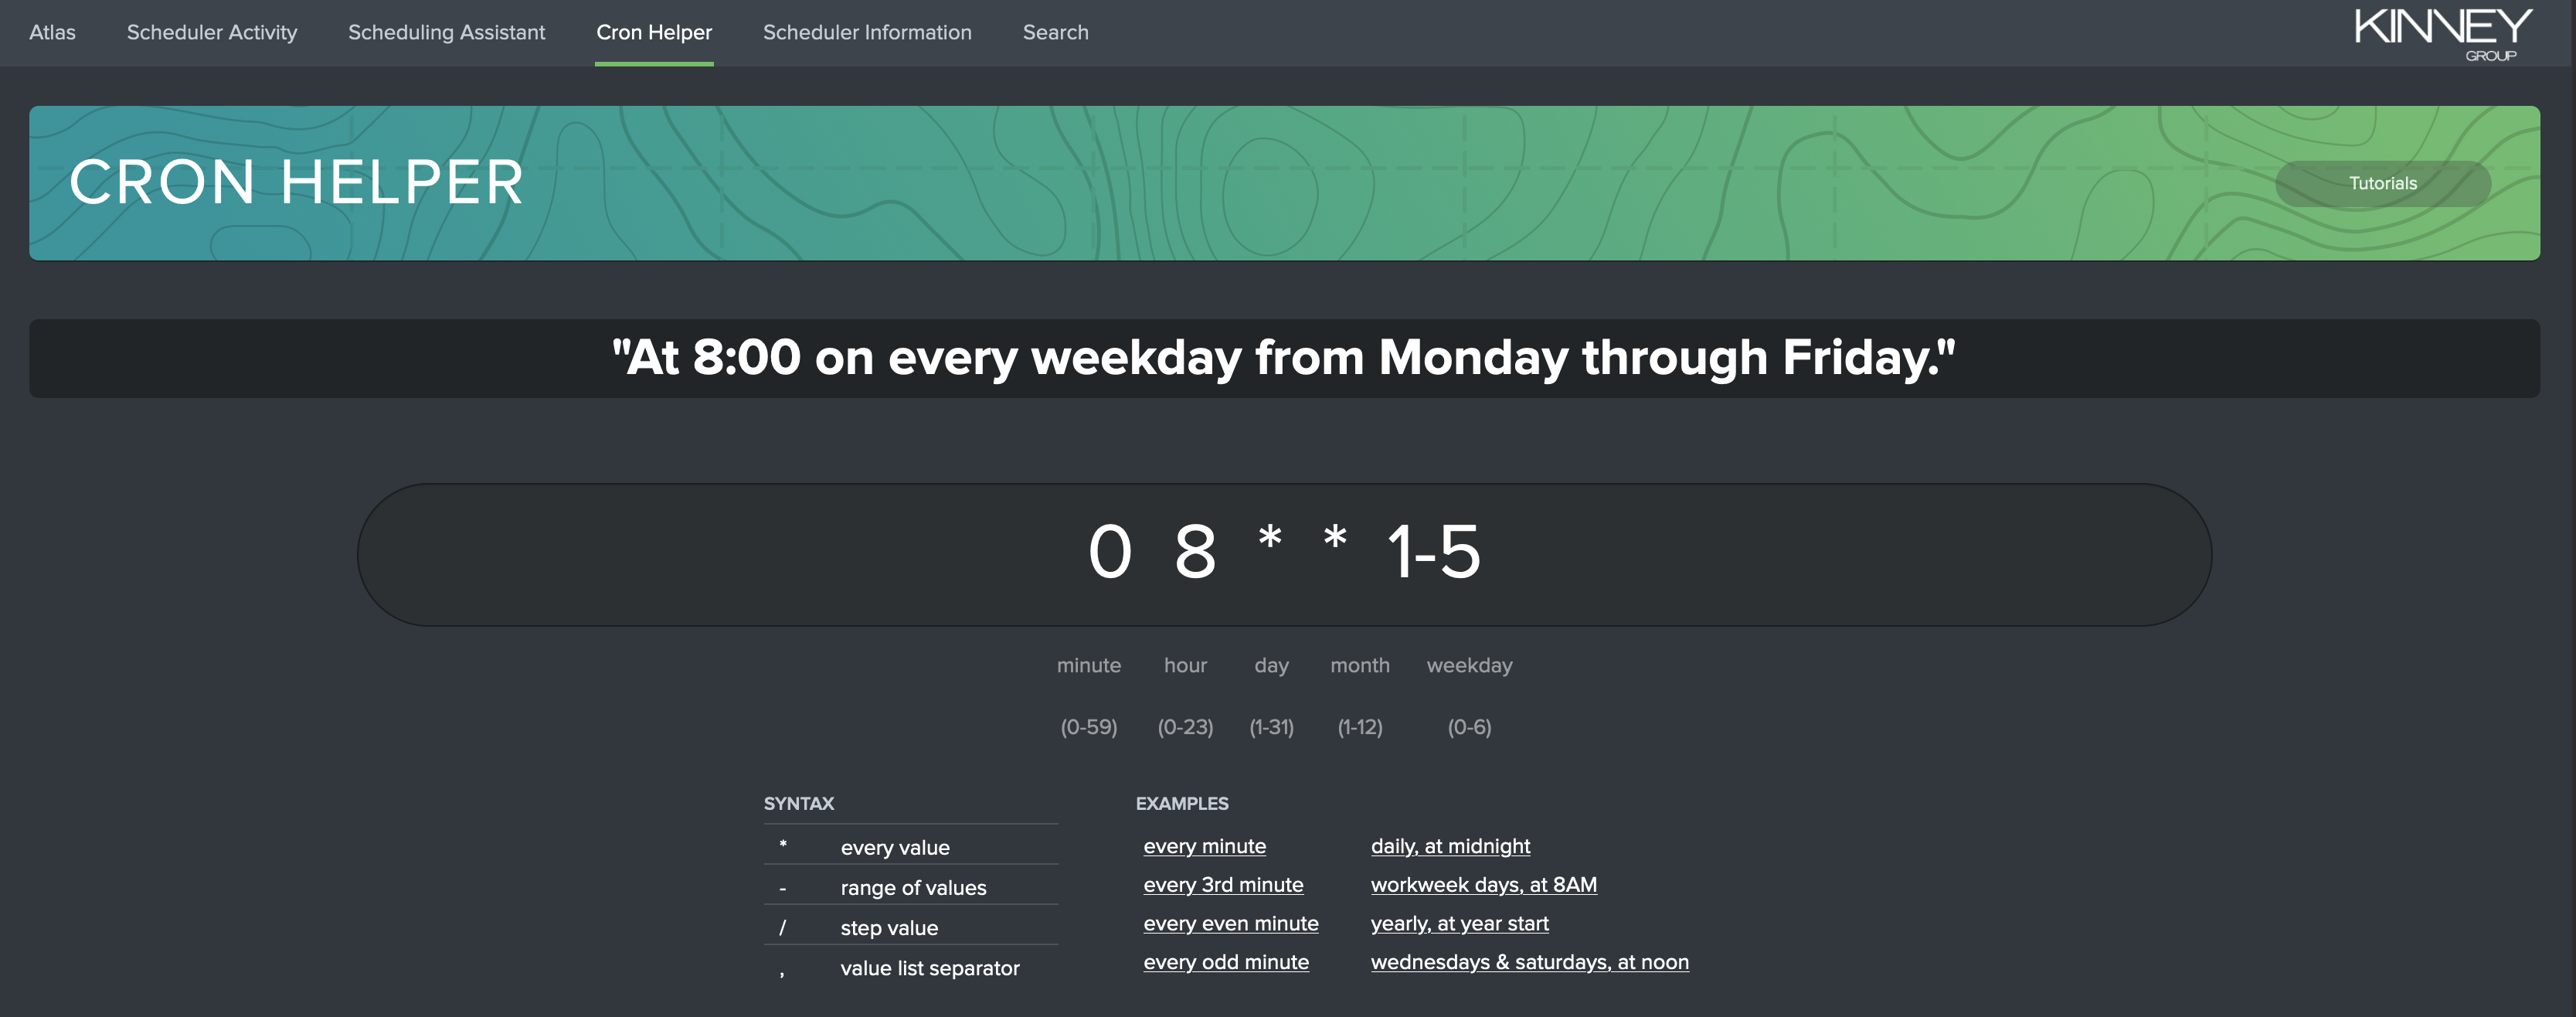
Cron Helper
For those Admins unfamiliar with the nature of Cron Scheduling or lack online resources for crafting Cron Schedule, Atlas aids with the Cron Helper dashboard. Admins can change the values in the middle and see how the schedule is altered with human-readable output. Also included are several examples in the bottom-right of the dashboard. Clicking these will populate the Cron Schedule with the appropriate values for that example.
Cron Schedule Tips
Master the "Admin Bump"
- The "Admin Bump" refers to a technique for reducing concurrency by shifting some (but not all) scheduled searches by a short amount of time. Take a current cron schedule such as
0,15,30,45 * * * *, which runs every 15 minutes. If you're environment has many searches running at the same 15 minute increment, your concurrency will be high and performance will suffer. Take some of the searches on that 15 minute interval and add around 2-4 minutes on each mark, so it turns into2,17,32,47 * * * *. This will ensure that despite each schedule having that same interval, they never run concurrently. Make sure to use the Scheduling Assistant to ensure this new "bumped" schedule is actually good for the environment and enact it.
- The "Admin Bump" refers to a technique for reducing concurrency by shifting some (but not all) scheduled searches by a short amount of time. Take a current cron schedule such as
Most Harm, Best Results
- Unsure on where to start? Find the search with the highest skipped rate, or longest run time, and give the search the time and solitude it needs to perform its advanced search. This will ensure it won’t cause other searches to skip while it takes its time. Use Scheduling Assistant to ensure its new schedule remains the same cadence but is cleared of other searches!
Lower those Mountain Ranges
- Using the Time Chart, find patterns of spikes and identify what searches are part of these "mountain ranges" of limit breaking spikes. Use the Scheduling Assistant to push these searches down the timeline, using techniques like the "Admin Bump", and turn the peaks and valleys into nice rolling hills.
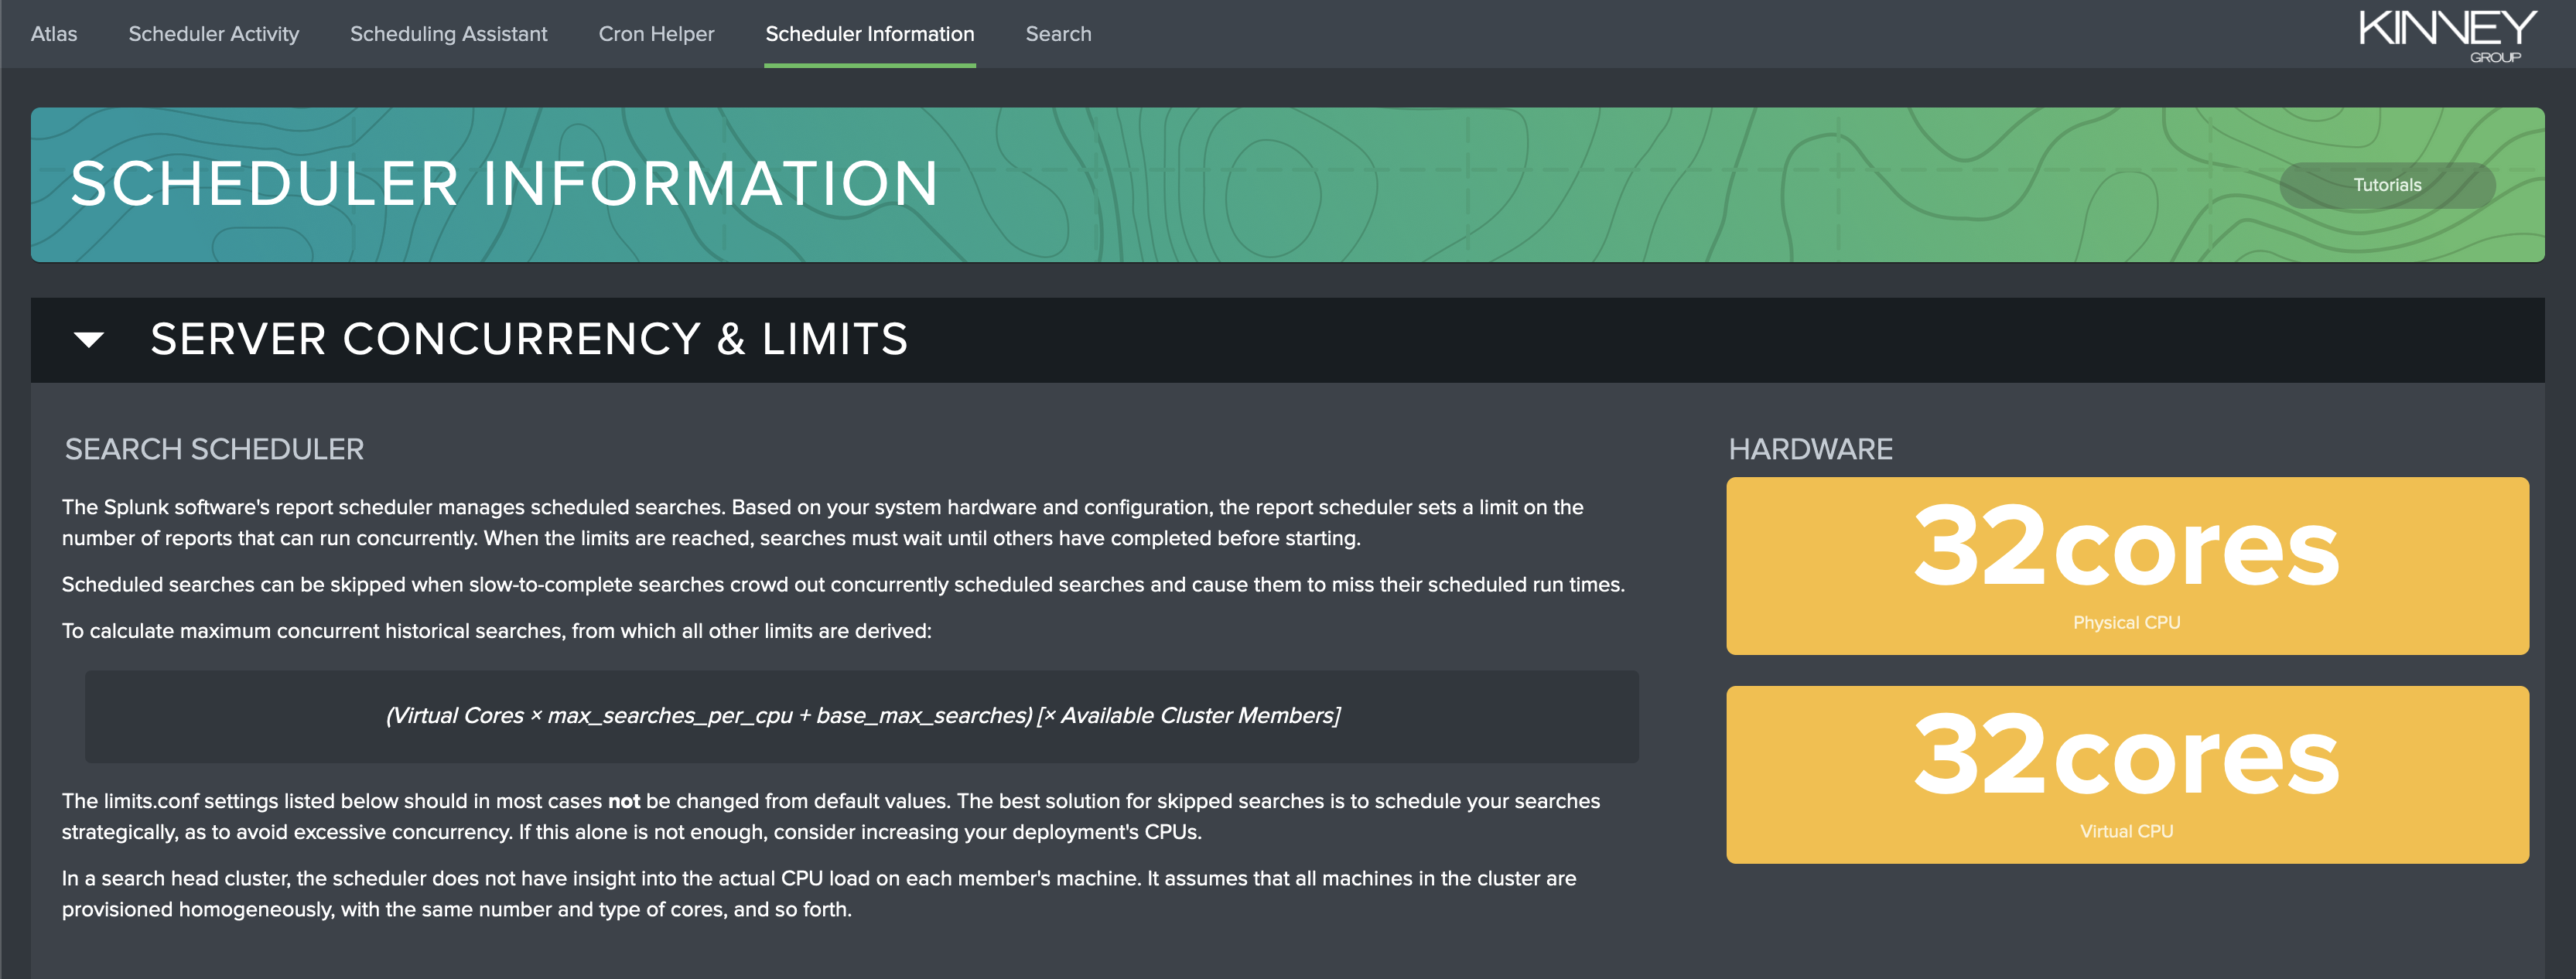
Scheduler Information Dashboard
Finally, Atlas’s Scheduling Assistant offers one of the best overviews of complex Splunk topics related to concurrency on the Scheduler Information dashboard. This dashboard will show how Splunk environment limits are determined and display current configurations.
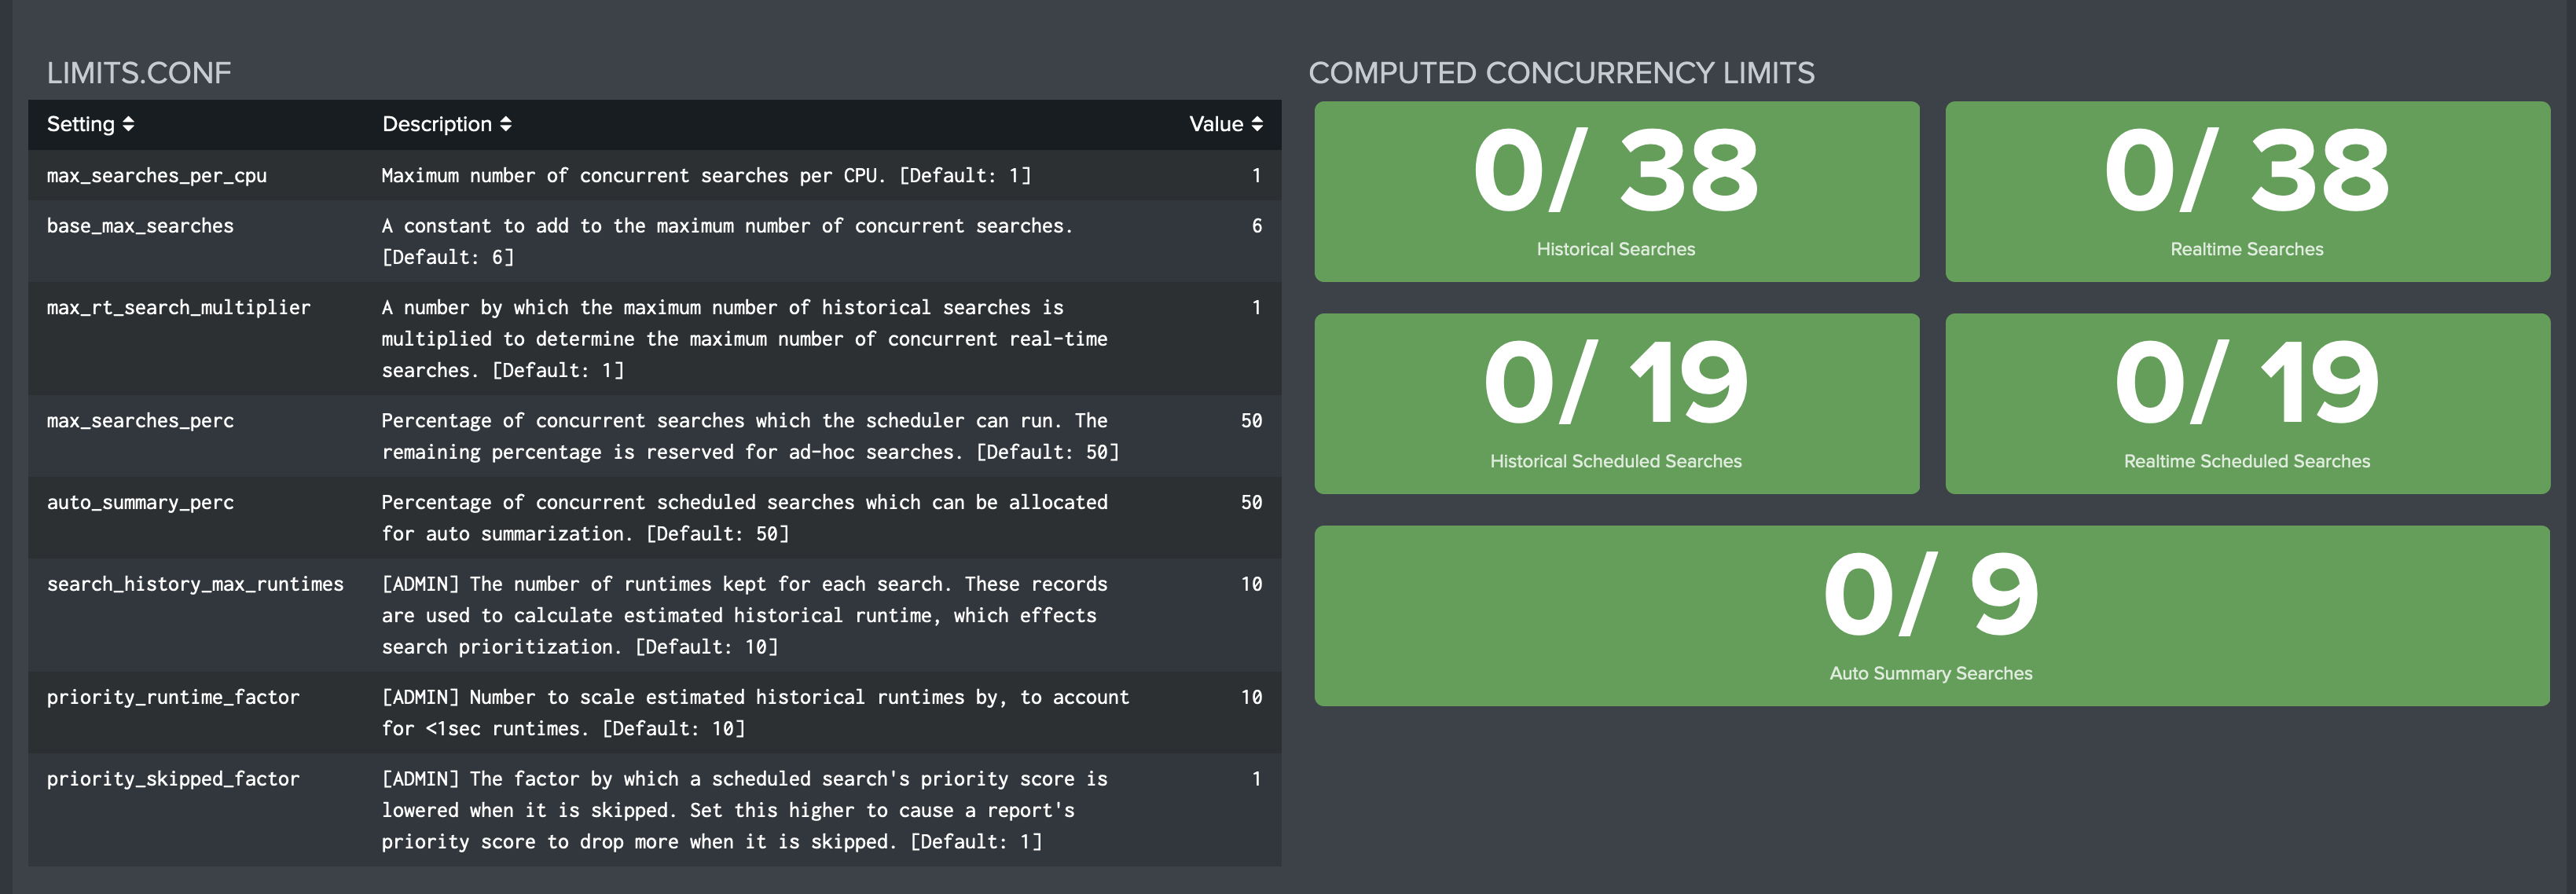
The Scheduler Information dashboard also contains a description of each field in the limits.conf file to help Admins edit this file quickly and correctly. The dashboard also shows several KPIs which display the Concurrency Limits compared to the current usage.
Skipped Search Self Service Email
Scheduling Assistant comes packaged with the Atlas Skipped Search Self Service Alert, which enables Admins to empower their users to fix their own searches using the Scheduling Assistant Element. This search can be found in the 'Searches, Reports, and Alerts' page, with Scheduling Assistant selected as the app, and filtering under all owners. The Self Service alert executes every hour, looking for searches that have skipped over a certain amount of times in the past 24 hours. If a scheduled search has skipped over the threshold, then the owner of the skipped search will receive an email pointing them to Scheduling Assistant with their search already selected, enabling them to test new schedules and reschedule the search to a better time slot. This workflow is powerful for making users aware of their searches' performance, while giving them the tools necessary to improve their situation.
The alert starts disabled on Atlas install, but can be enabled for use.
Configuring Self Service Email
The Atlas Skipped Search Self Service Alert search can be configured using built in Splunk macros to personalize the workflow. These macros are found under the Advanced Search settings of the application, and are described below. Please refer to Expertise on Demand for further assistance with configuring and enabling the Self Service feature.
SelfServiceAdminEmail: Email of Splunk admin. System will notify this email if there is no identified owner of the search. Defaults to "changeme@example.com"
SelfServiceSHClusterPeer: If Atlas is deployed on a Search Head Cluster, or a Stand-alone Search Head that is Search Peered to a Search Head Cluster, set this macro to host name of a Splunk Search Head in the Cluster. This will enable links to Scheduling Assistant from the Self Service email to function. Defaults to "none".
SelfServiceFixedCount: Number of skips a search must surpassed for the search owner to be notified. Defaults to "5"
SelfServiceTarget: URL of the search head the notified users should be directed to. Defaults to "https://localhost:8000"
Additional Configurations
Scheduling Assistant has additional optional configurations as macros. The following list explains these features.
submitButton__scheduling_assistant: Set to '0' on default. Setting to '1' will add a Submit button to the Scheduling Assistant dashboard, preventing the base search load until the submit button is pressed.
atlas_timeout: This configuration is saved in Atlas Core. It is default set to 'timeout=60'. Increasing this from 60 is useful for larger environments to ensure searches complete.