Identify Jobs over Concurrency Limits
Identify Problematic Concurrent Searches
On the Scheduler Activity dashboard of the Scheduling Assistant Element, navigate down to the Concurrency Investigation section. There will be two visuals that will help identify the source of concurrency issues.
Using the Cron Schedule Details Table
This report enables users to sort by Concurrent Scheduling per Year or Average Concurrency to identify searches that run next to many other searches or on average run in congested times. Factor in the number of times the search is ran in the Scheduled Runs per Year column to see the effect improving this search will have on the environment.
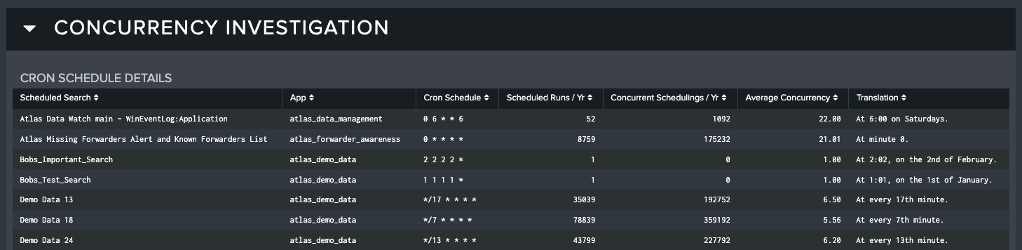
Scheduled Runs per Year
- counts how many times this search will run on the environment in a 365-day period
Concurrent Schedules per Year:
- counts how many searches run at the same time as the identified search in a 365-day period
Average Concurrency:
- counts the average of the number of concurrent searches that fire off when the identified search runs
For example, the Scheduled Search called "Demo Data 13" with 35,039 Scheduled Runs Per Year; 192,752 Concurrent Schedulings per Year; and an Average Concurrency of 6.5 means:
- "Demo Data 13" runs 35,039 times a year; and during the time slot it runs, 192,752 other searches also start; with an average of around 6.5 other searches for each time it runs.
This search is a prime candidate for improvement, as all three of these numbers are relatively high. It's also important to make sure that your candidate search's "App" field isn’t Enterprise Security or other premium apps. If a search matches these criteria, it is a good idea to improve its schedule using the process detailed in using Scheduling Assistant dashboard.
Using the Historical Searches Scheduled In Time Range Time Chart
Under the Concurrency Investigation dashboard, there is a Time Chart that offers a visual analysis of Concurrency spikes. To get more useful data for identifying Concurrency issues, make sure to change the time range under the Concurrency Investigation header to "Today". Then, above the aforementioned Time Chart, select "minutes" as the Time Unit to get a clear picture.
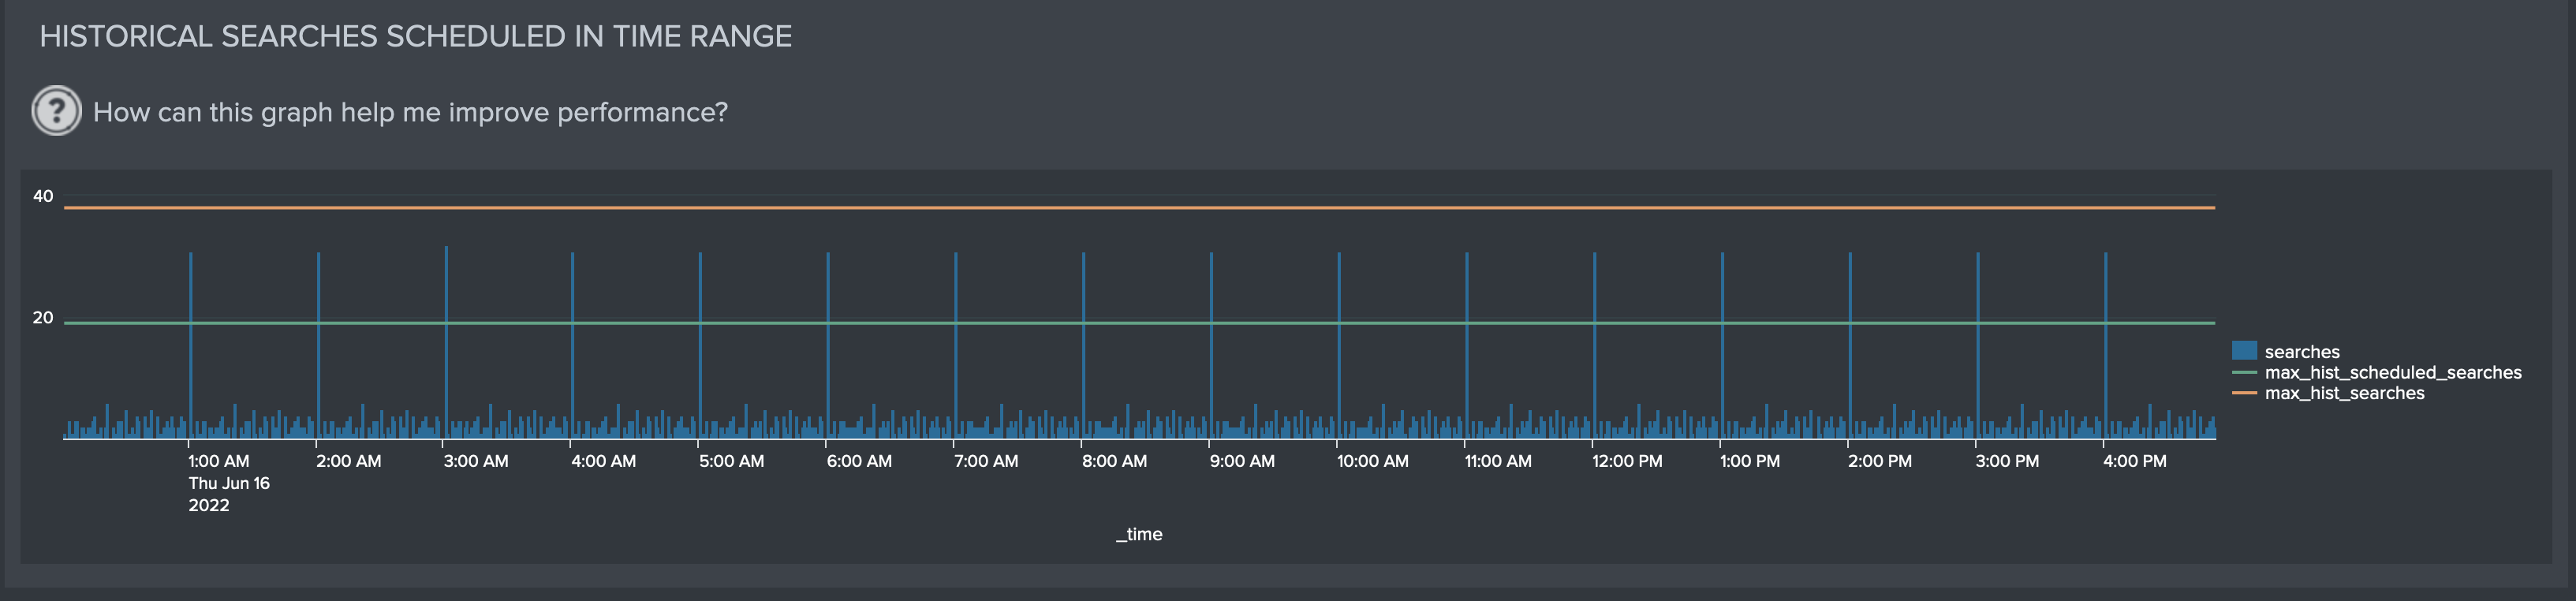
These bars represent the number of concurrent search in the system at each minute. The two limits offer insights into how environments can handle multiple searches and crossing the bottom threshold of Max Historical Scheduled Searches is tracked as a concurrency warning in the Health Score. You can identify moments when the bars representing stacked searches crosses the threshold. We can identify that, in this environment, the top of the hour is a time period where searches cross the limit. Select the bar to view the searches.
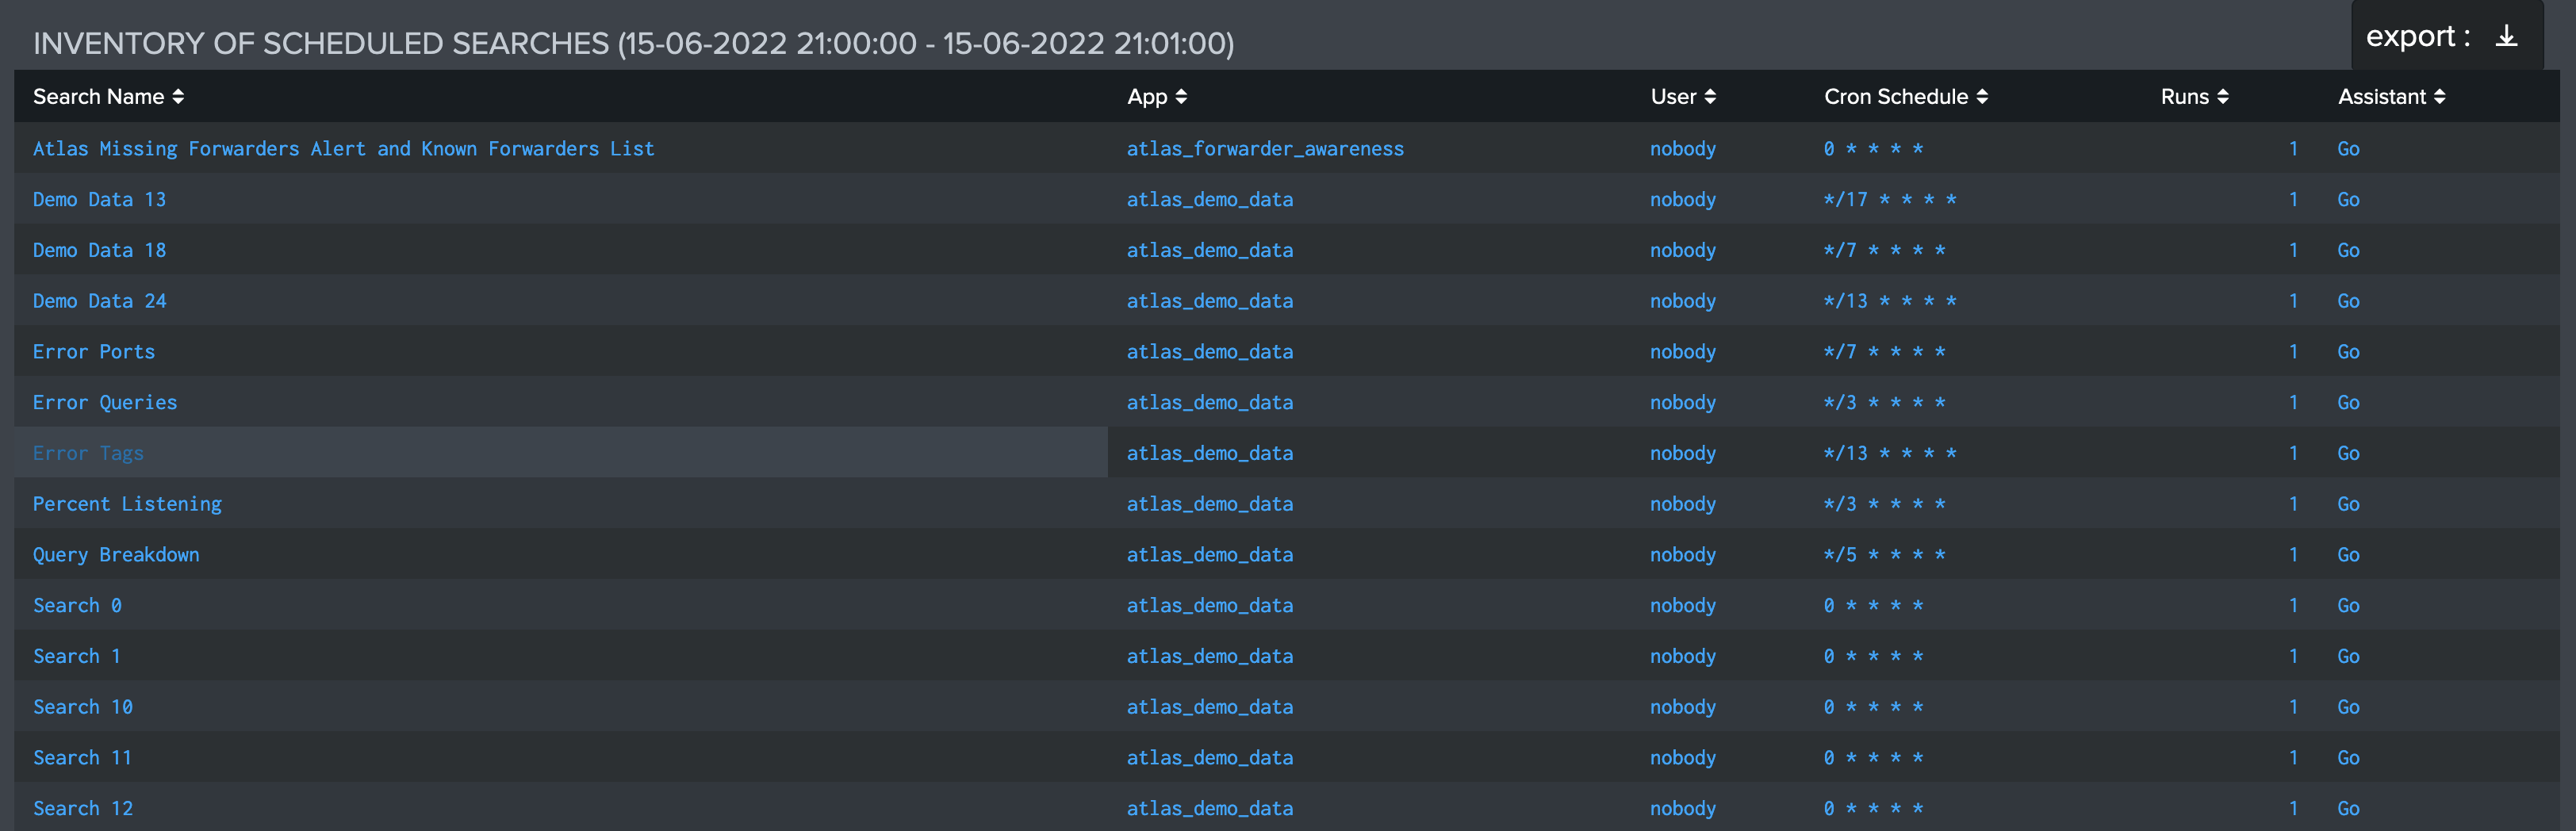
This group of searches are stacked so much on top of each other it poses a threat to the Splunk environment, and if not properly managed, can lead to more skipped searches and issues for users. As you can see in the "Cron Schedule" field, all of these searches (not all are shown) kick off at the start of the hour, which is what's causing the spikes on the chart. These searches would be good candidate searches for the type of improvement detailed in the documentation for using Scheduling Assistant dashboard.