Using Splunk Performance and Capacity Analytics
The Splunk Performance and Capacity Analytics (PCA) Atlas element enables Admins to monitor the status and performance of their Splunk environment without having to locate and watch numerous dashboards.
Recommended Architecture
For clustered Splunk Environments, it is recommended to deploy the Splunk Performance & Capacity Analytics element on a dedicated Search Head that is 'search peered' to all of the other Splunk search heads. This will enable PCA to contact and accurately analyze the entire search environment.
The Search Head that PCA is deployed to, dedicated or otherwise, should also be search peered to the following Splunk servers, if they exist, to expand PCA visibility across the entire Splunk environment:
- Splunk Indexing Tier
- License Manager
- Cluster Manager
- Heavy Forwarders
- Deployment Server(s)
- Deployer(s)
For assistance with search peering, reach out to the Customer Experience Team for support, or follow the Splunk Documentation on this topic.
Note that if PCA must be deployed in a Search Head Cluster, you should also follow the instructions to 'Replicate the search peers across the cluster' as found in this Splunk document: Distributed Search.
Configuration
The following configuration process is required in order to begin using the element.
In addition to the search peering described in the previous section, it is essential that the Splunk Performance and Capacity Analytics element is aware of which role(s) each of the hosts in your Splunk environment serve. After the Splunk Performance and Capacity Analytics element has been deployed into your Splunk environment, a setup procedure must be followed that will assign a role(s) to each Splunk server. The following steps will guide you through the setup workflow:
Navigate to the PCA element and select Configuration on the navigation bar
The environment Configuration table will populate with all Splunk servers that have been identified
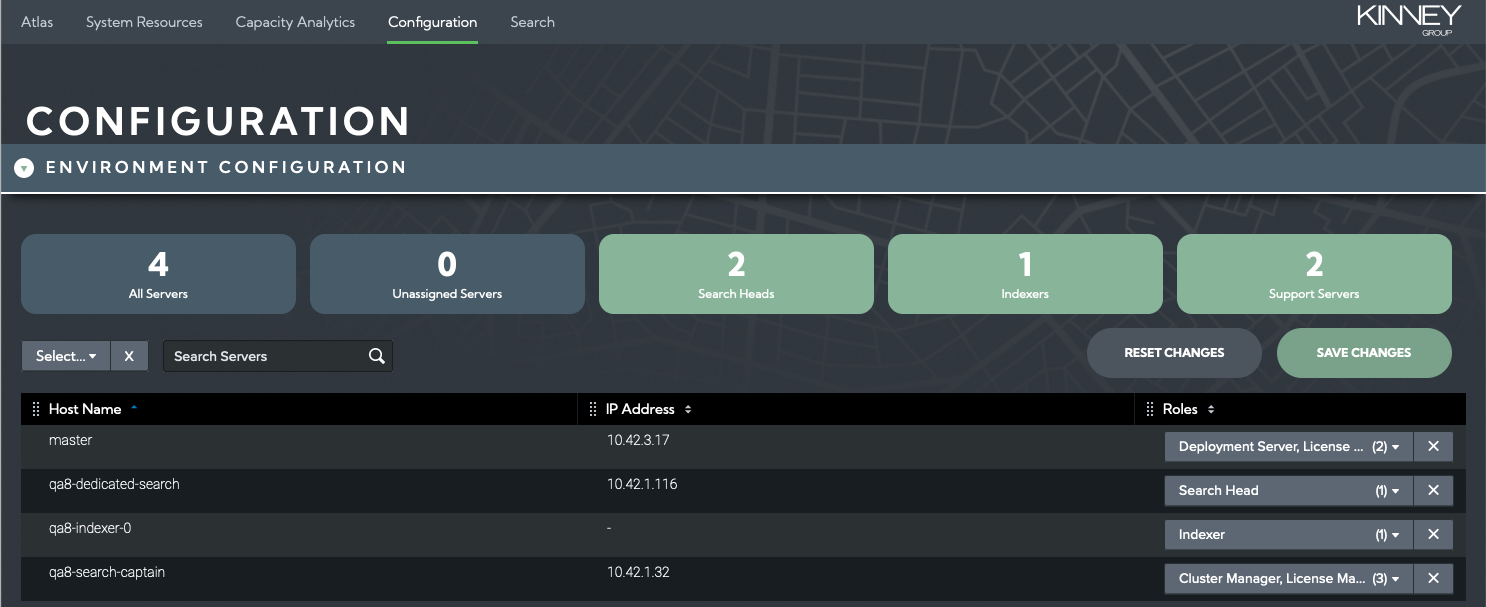
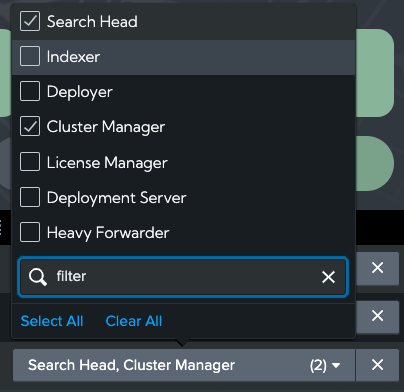
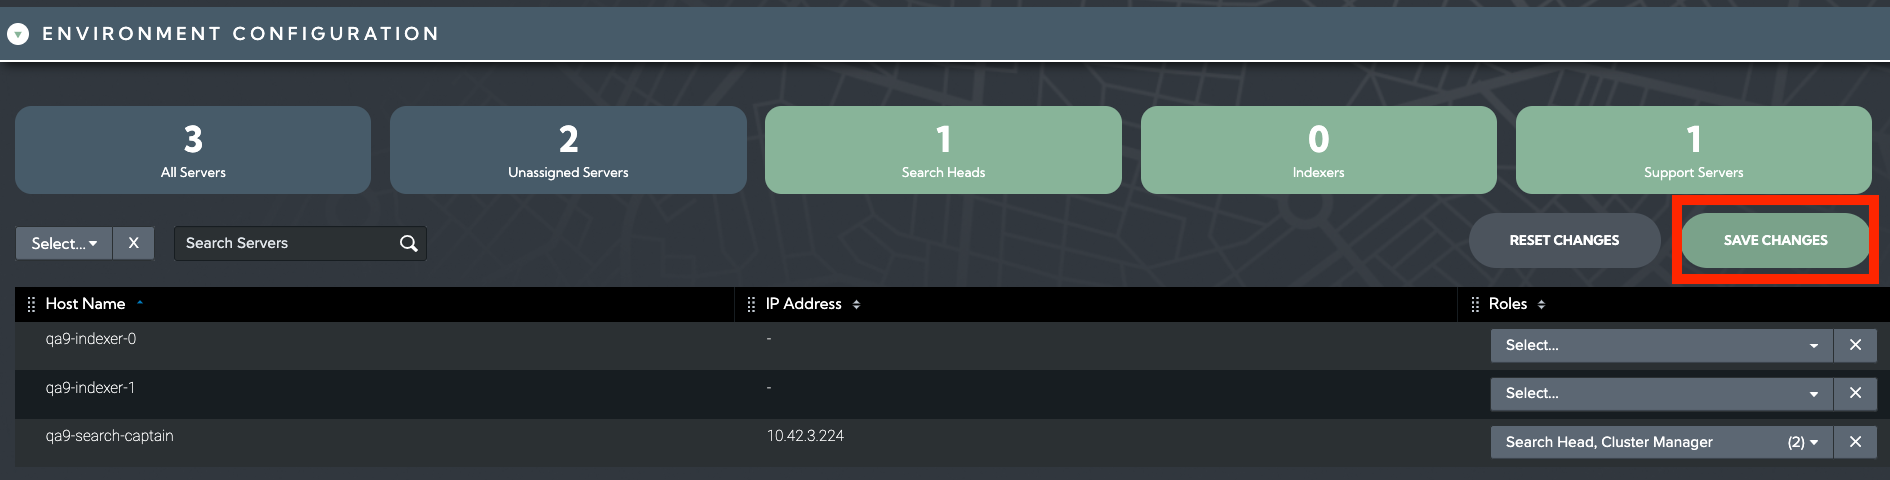
Select what role (or roles) are applicable to each host
Select Save Changes button to update PCA
The Splunk Servers will now appear in the System Resources and Capacity Analytics dashboards under the correct tier.
atlas_pca_summary_metrics Index
The Capacity Analytics dashboard provides views of historical data collected by a variety of resource-specific saved searches and stored in an atlas_pca_summary_metrics metrics index which must be created in your indexing environment. The following entries should be included in the appropriate indexes.conf file and deployed to your environment:
[atlas_pca_summary_metrics]
datatype = metric
enableDataIntegrityControl = 0
enableTsidxReduction = 0
coldPath = $SPLUNK_DB/atlas_pca_summary_metrics/colddb
homePath = $SPLUNK_DB/atlas_pca_summary_metrics/db
thawedPath = $SPLUNK_DB/atlas_pca_summary_metrics/thaweddb
# Maximum storage size is 512 GB
maxTotalDataSizeMB = 512000
# Data retention period is 2 years
frozenTimePeriodInSecs = 63072000
You may wish to adjust the maxTotalDataSizeMB or frozenTimePeriodInSecs values to extend or shrink the storage size and retention period limits according to your needs and policies. However, keep in mind that resource and license capacity planning becomes more accurate with longer historical data sets.
System Resources Dashboard
The System Resources page is opened by default when the PCA application is started or selected from the menu bar. This view provides a quick status and overview of the most critical performance metrics for a Splunk environment which can be checked periodically to stay ahead of developing issues.
This dashboard automatically updates every 5 minutes to ensure it reflects the latest information.
Note that CPU and Memory utilization metrics reported in Atlas PCA are the 95th Percentile of the values from the sample time period. For example, CPU and Memory measurements are typically recorded in Splunk in 10 second increments. The PCA reported CPU utilization is the 95th percentile of all of the 10-second samples across the 5-minute reporting period. A 95th percentile measurement is useful for capturing the highest nominal values without being unduly affected by peak outliers.
Splunk Summary Status
Across the top of the System Resources dashboard are summary indicators that reflect the most critical performance metrics for the Splunk environment.
The top row of KPIs provides the current status of essential Splunk support services and data integrity. The second row contains critical performance KPIs bounded by thresholds that go yellow for warning, and red if they are in alert.
These KPIs are the best place to start when reviewing the System Resources dashboard as they can point the user to areas needing further investigation.
The following KPI values are displayed on the System Resources dashboard:
- License Manager Reachable
- Cluster Manager Reachable
- All Data Searchable
- Replication Factor Met
- Search Factor Met
- Indexing Queuing Severity
- Max Ingestion Rate - MBps
- Max Indexer CPU Util Pct
- Max Search Head CPU Util Pct
- Est Per-Indexer Ingest - GB/Day
Splunk Server Status
This section provides overall availability and health status of the servers in your Splunk implementation. The table displays counts by status of each type of server based on role assignment.
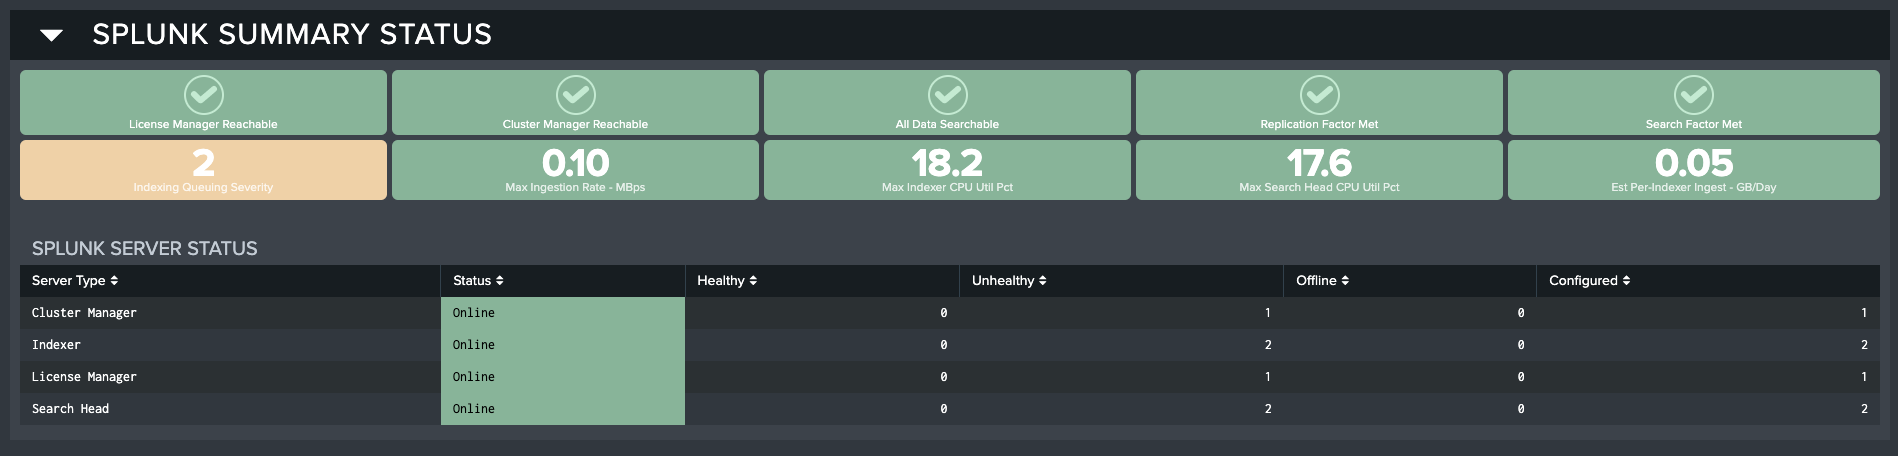
The Splunk Server Status table has the following fields:
- Server Type: Which type of server is being monitored according to how this was setup in the element configuration
- Status: Online or Offline
- Healthy: Count of servers reporting back as Healthy for this server type
- Unhealthy: Count of servers reporting back as Unhealthy for this server type
- Offline: Count of servers found to be Offline for this server type
- Configured: Count of servers Configured (and expected to be Online) for this server type
Indexing Tier Status
This section provides key performance metrics for all of the servers in your indexing tier. You can investigate key metrics and identify problems that may be present or developing in your environment.
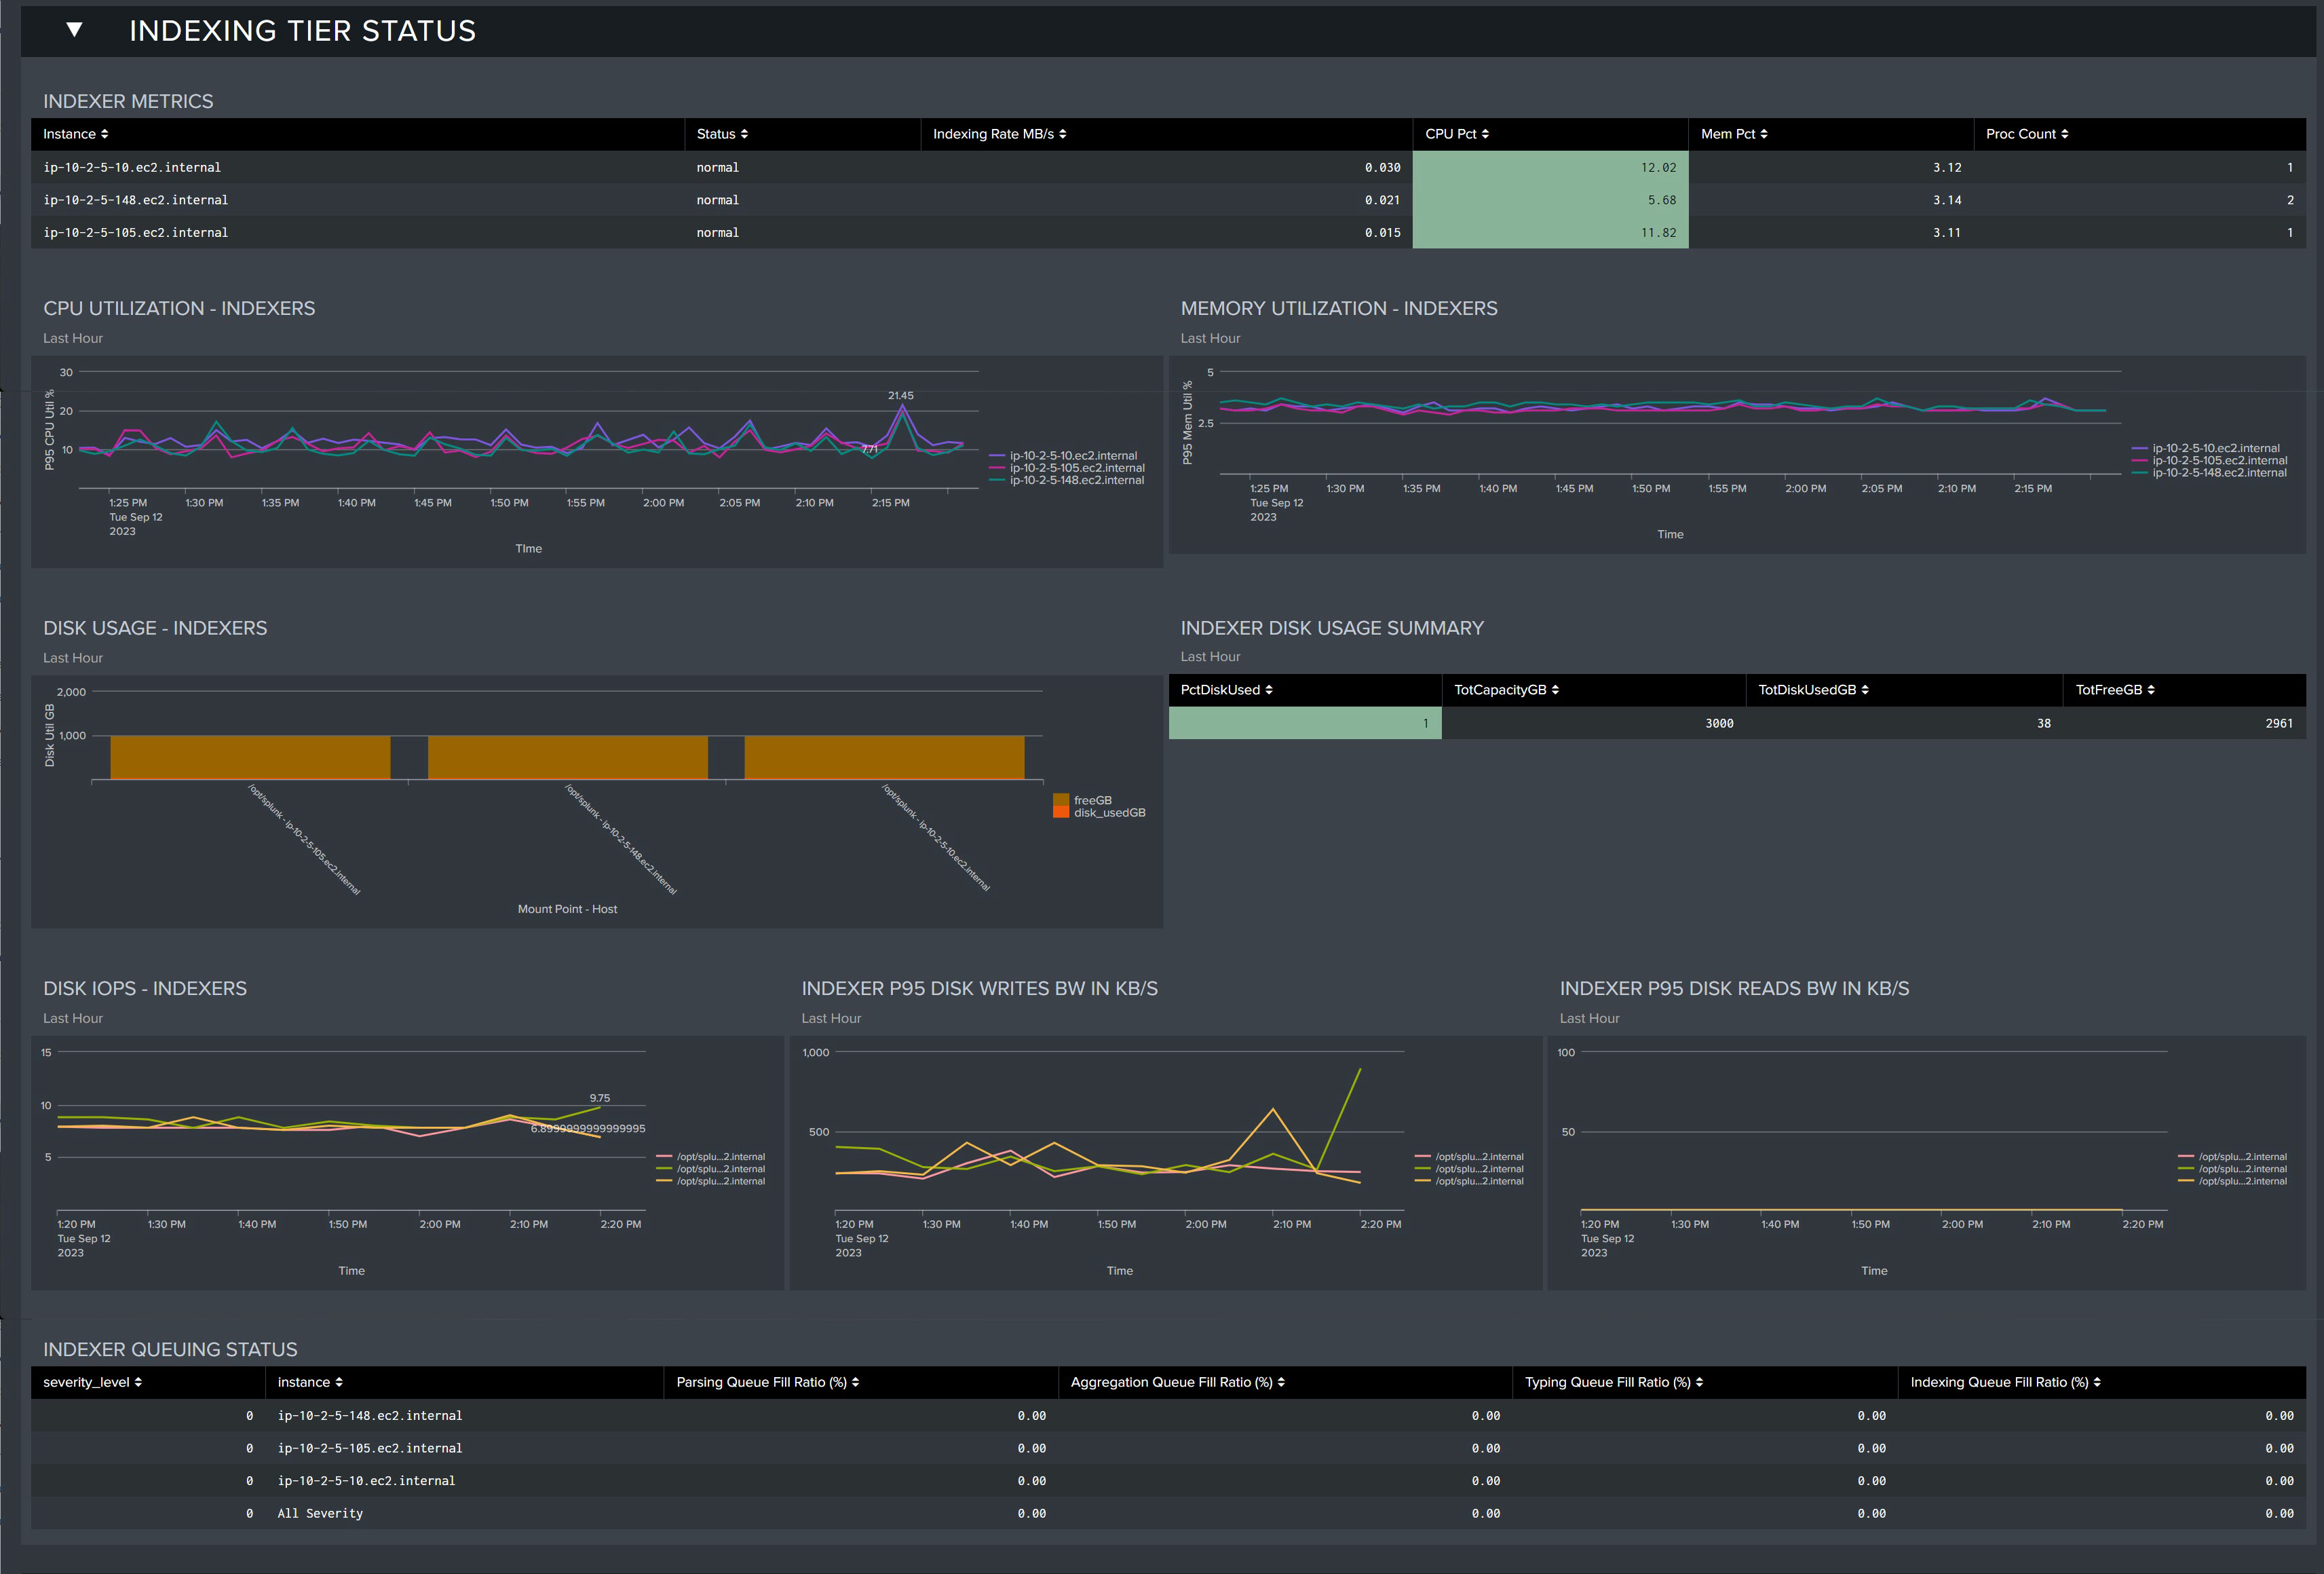
Indexer Metrics: Table that displays the current health status of each of your indexers.
- Instance: Indexer server
- Status: Current status
- Indexing Rate MB/s: Rate at which data is being ingested (per second)
- CPU Pct: Percentage of CPU utilized
- Mem Pct: Percentage of Memory utilized
- Proc Count: Process Count
CPU Utilization - Indexers: CPU utilization trends for all indexer servers in the last 60 minutes
Memory Utilization - Indexers: Memory utilization for all indexer servers in the last 60 minutes
Disk Usage - Indexers: Disk utilization for each index server as of the last 60 minutes
Indexer Disk Usage Summary: Table displaying disk usage metrics as of the last 60 minutes
- PctDiskUsed: Percentage of disk utilized
- TotCapacityGB: Total Capacity in GBs
- TotDiskUsedGB: Total Disk Utilized in GBs
- TotFreeGB: Total disk free in GBs
Disk IOPS - Indexers: Measured IOPS for the Indexer disk storage
Indexer P95 Disk Writes BW in KB/S: 95th percentile disk write bandwidth from the last hour in KB/s
Indexer P95 Disk Reads BW IN KB/S: 95th percentile disk read bandwidth from the last hour in KB/s
Search Tier Status
This section provides key performance metrics for all of the servers in your search head tier. You can investigate key metrics and identify problems that may be present or developing in your environment.
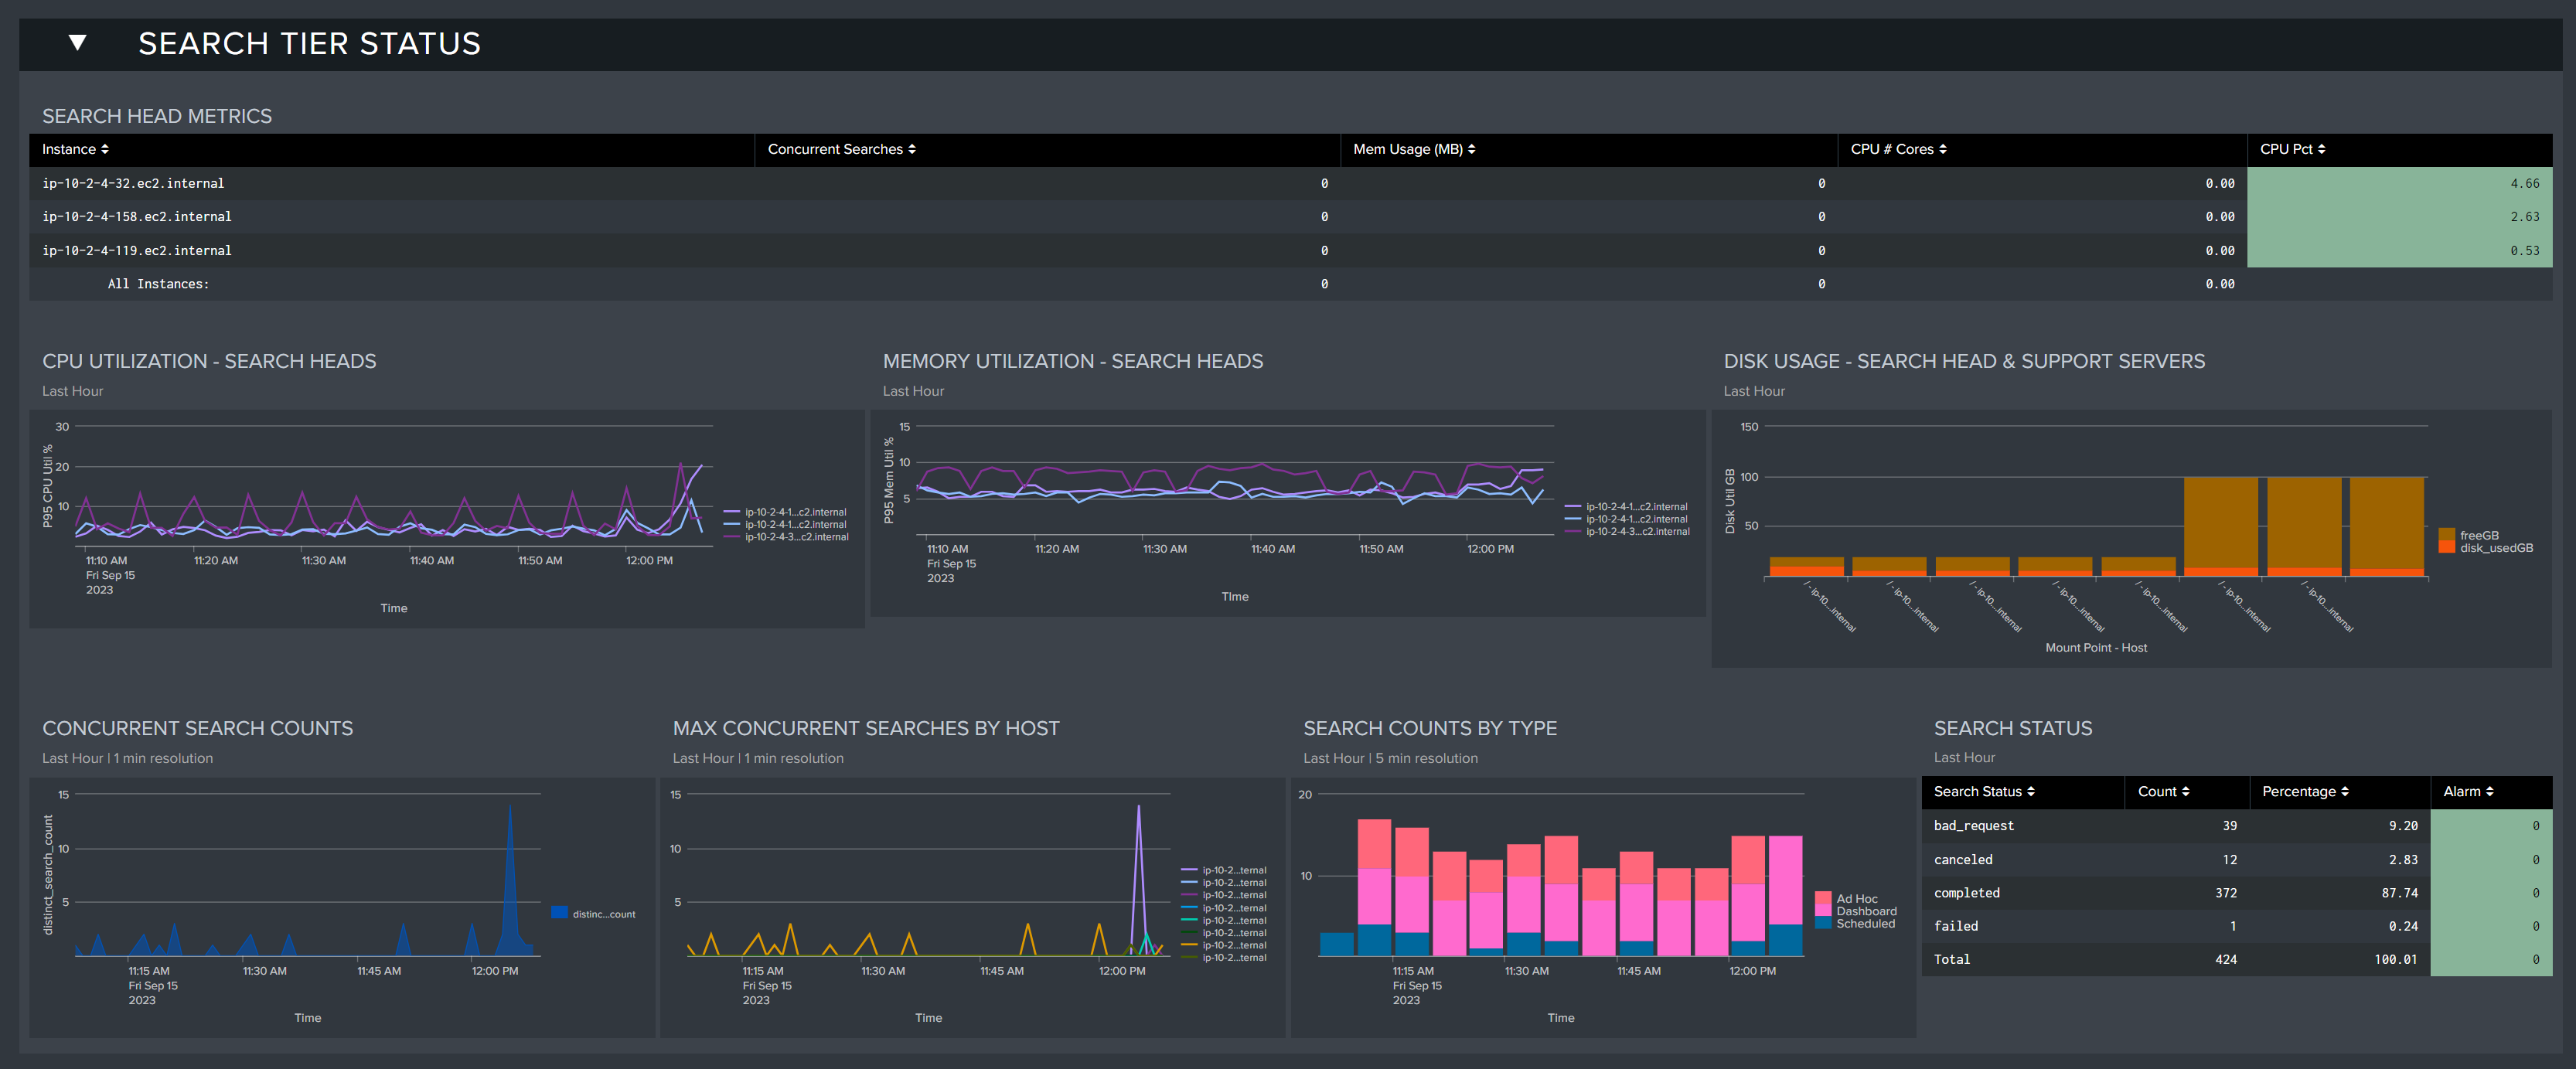
Search Head Metrics: Table that displays the current health status of each of your search heads
- Concurrent Searches: The number of concurrent searches being executed by the search head
- Mem Usage(MB): The amount of memory utilization in MB
- CPU # Cores: The effective number of utilized CPU cores in the environment
- CPU Pct: The percentage of CPU utilized on the search head
CPU Utilization - Search Heads: CPU utilization trends for all search head servers in the last 60 minutes
Memory Utilization - Search Heads: Memory utilization for all search head servers in the last 60 minutes
Concurrent Search Counts: Concurrent search counts in the last 60 minutes
Max Concurrent Searches by Host: The max concurrent searches by host in the last 60 minutes
Search Counts by Type: The number of searches by type being executed in the lat 60 minutes (Ad Hoc, Dashboard, Scheduled)
Search Status: Table displaying the status of searches in the last 60 minutes (Canceled, Completed, Granted, Total)
Search status can reflect several states. Granted means that the scheduler or the user was allowed to run the search - the search will run when possible. When the job is done, the status will change to completed. A search job can be delayed or queued depending on the prioritization, execution windows, or concurrent search limits - a failed status indicates a search was not able to run due to scheduling issues. These 'skipped' searches should be identified and rectified using the Atlas Search Inspector and Search Assistant elements. A search may be cancelled due to insufficient resources (Search Head RAM or other) or may have timed out.
Support Tier Status
The Support Tier includes all of the support servers such as the cluster manager, deployment server, and license manager. Here you can see detailed resource utilization metrics about these servers in this section.
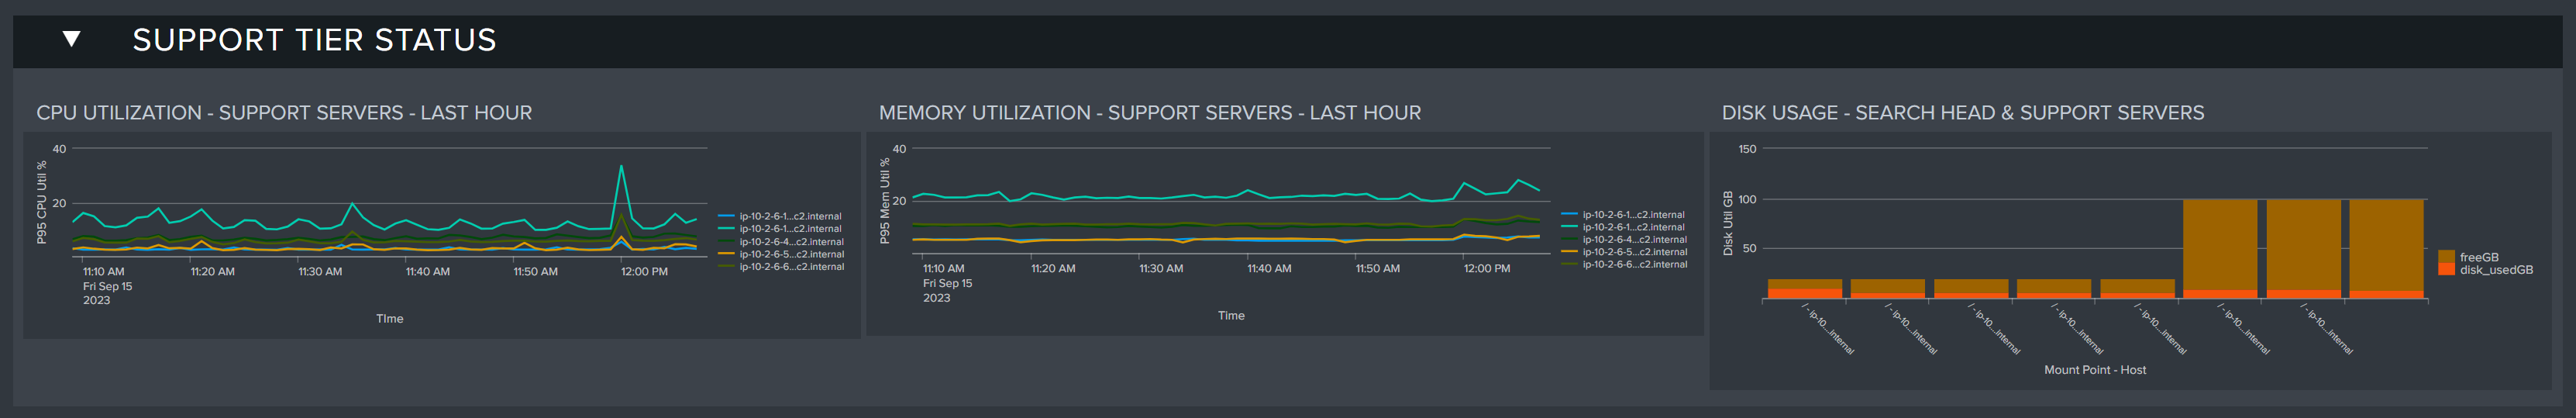
CPU Utilization-Support Servers-Last Hour: CPU utilization of the support servers within the last 60 minutes (displays no results if no servers have been assigned to support roles)
Memory Utilization - Support Servers - Last Hour: The memory utilization of all support servers within the last 60 minutes
Disk Usage - Search Head & Support Servers: The disk usage for the search head and support servers within the last 60 minutes
Ingest Status
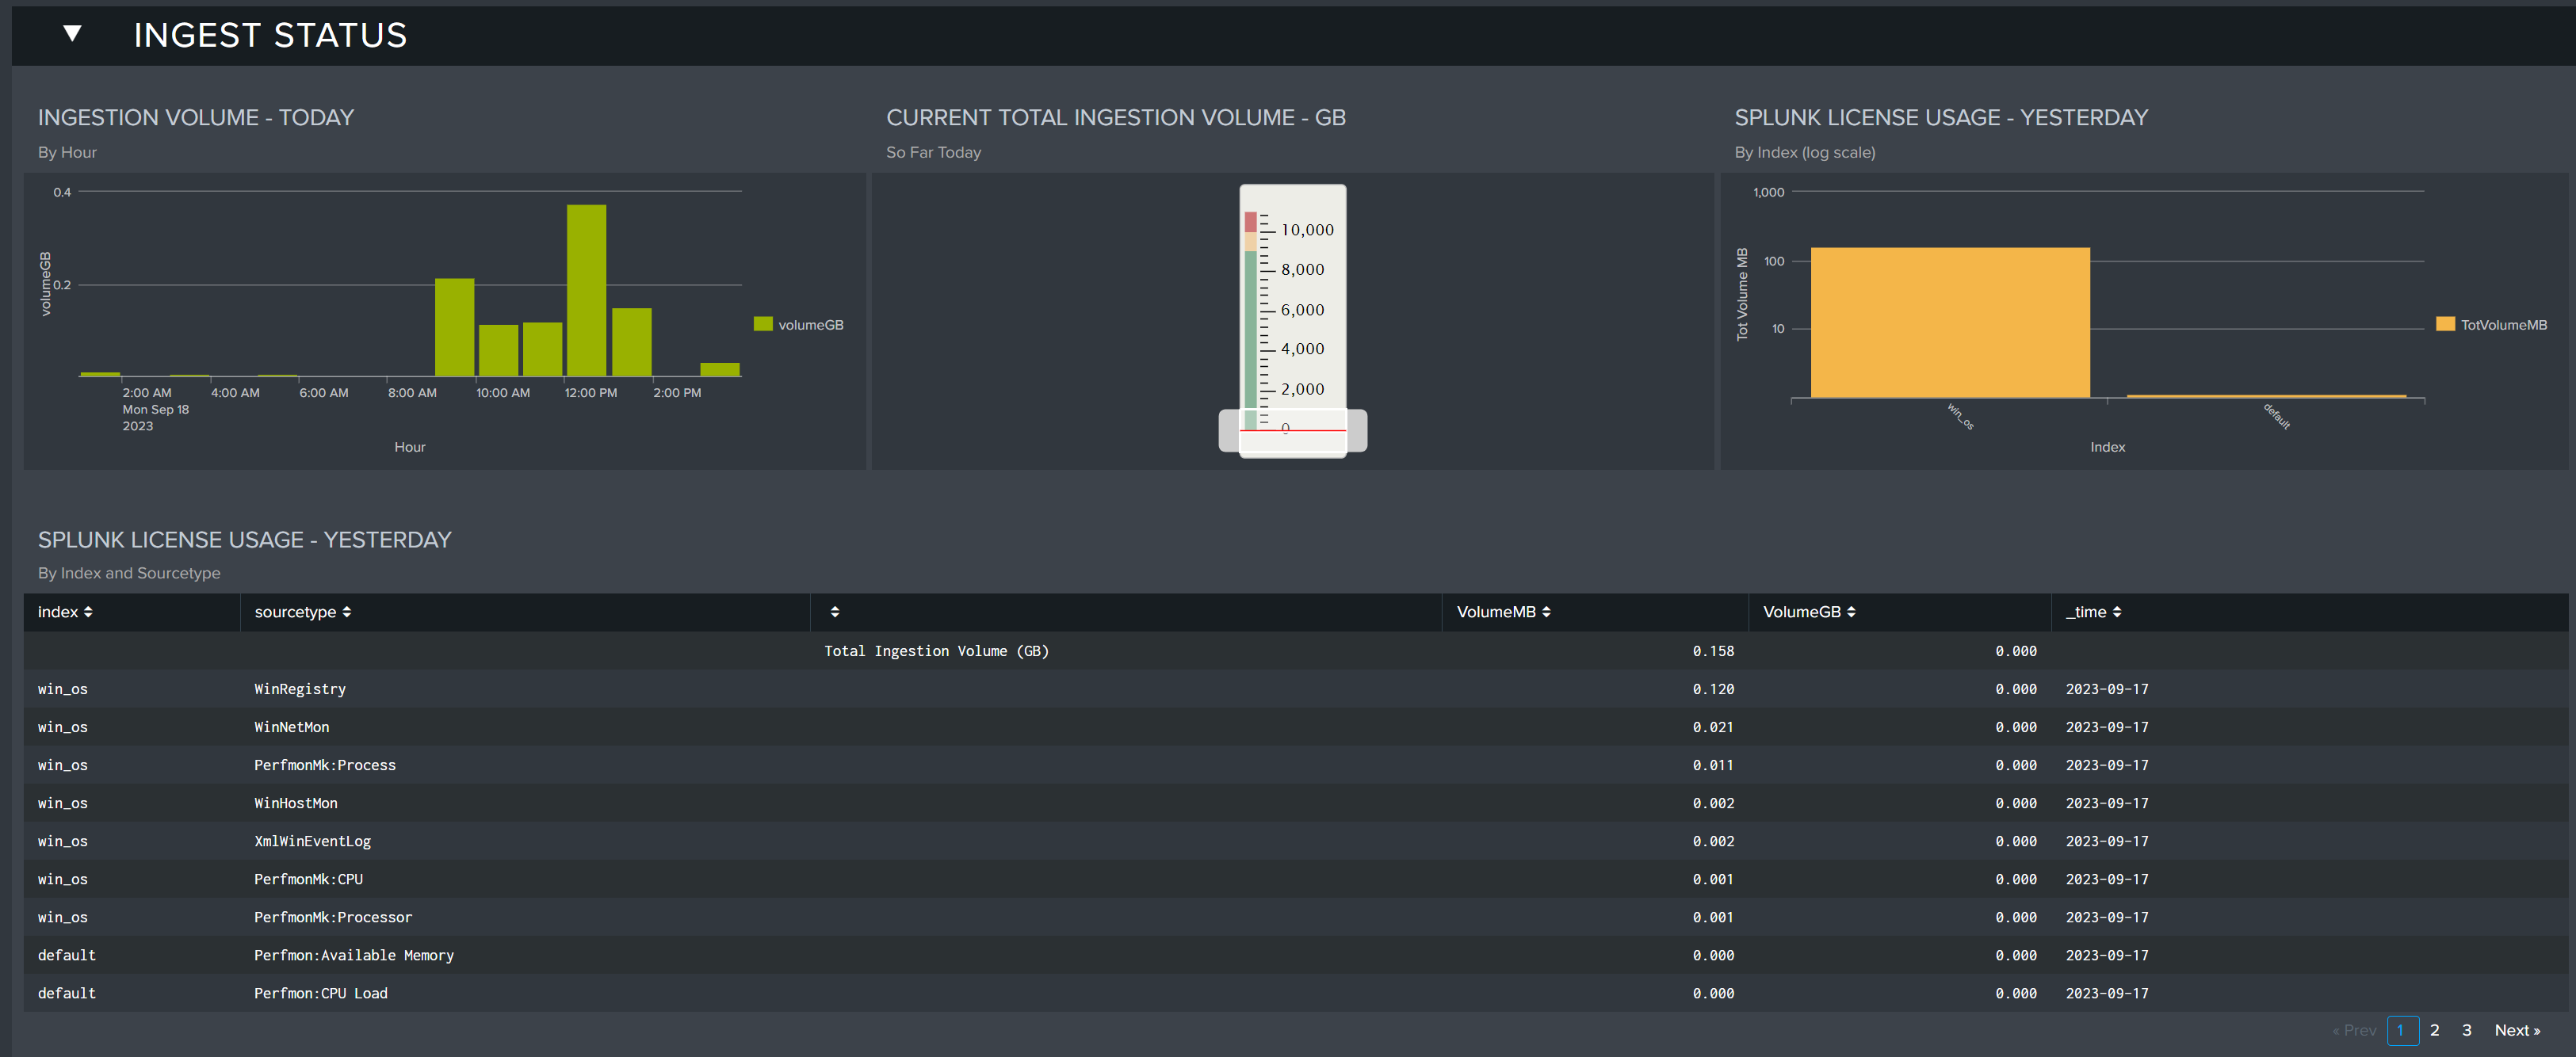
The Ingest Status section shows data ingest levels across the current and previous days. By comparing these metrics, Splunk admins can spot discrepancies before they become issues, and identify any spikes by individual Source Types. Keeping tabs on these values can help admins track any non-communicated changes to their data pipeline.
Ingest Volume - Today: Displays the ingest volume for today by hour
Current Total Ingestion Volume - GB: Displays the current total ingest volume for the day so far in GB.
Splunk License Usage - Yesterday: Displays the license usage by index for yesterday
Splunk License Usage - Yesterday: Displays a table of Splunk license usage for the previous full day by index and sourcetype
Environment Overview
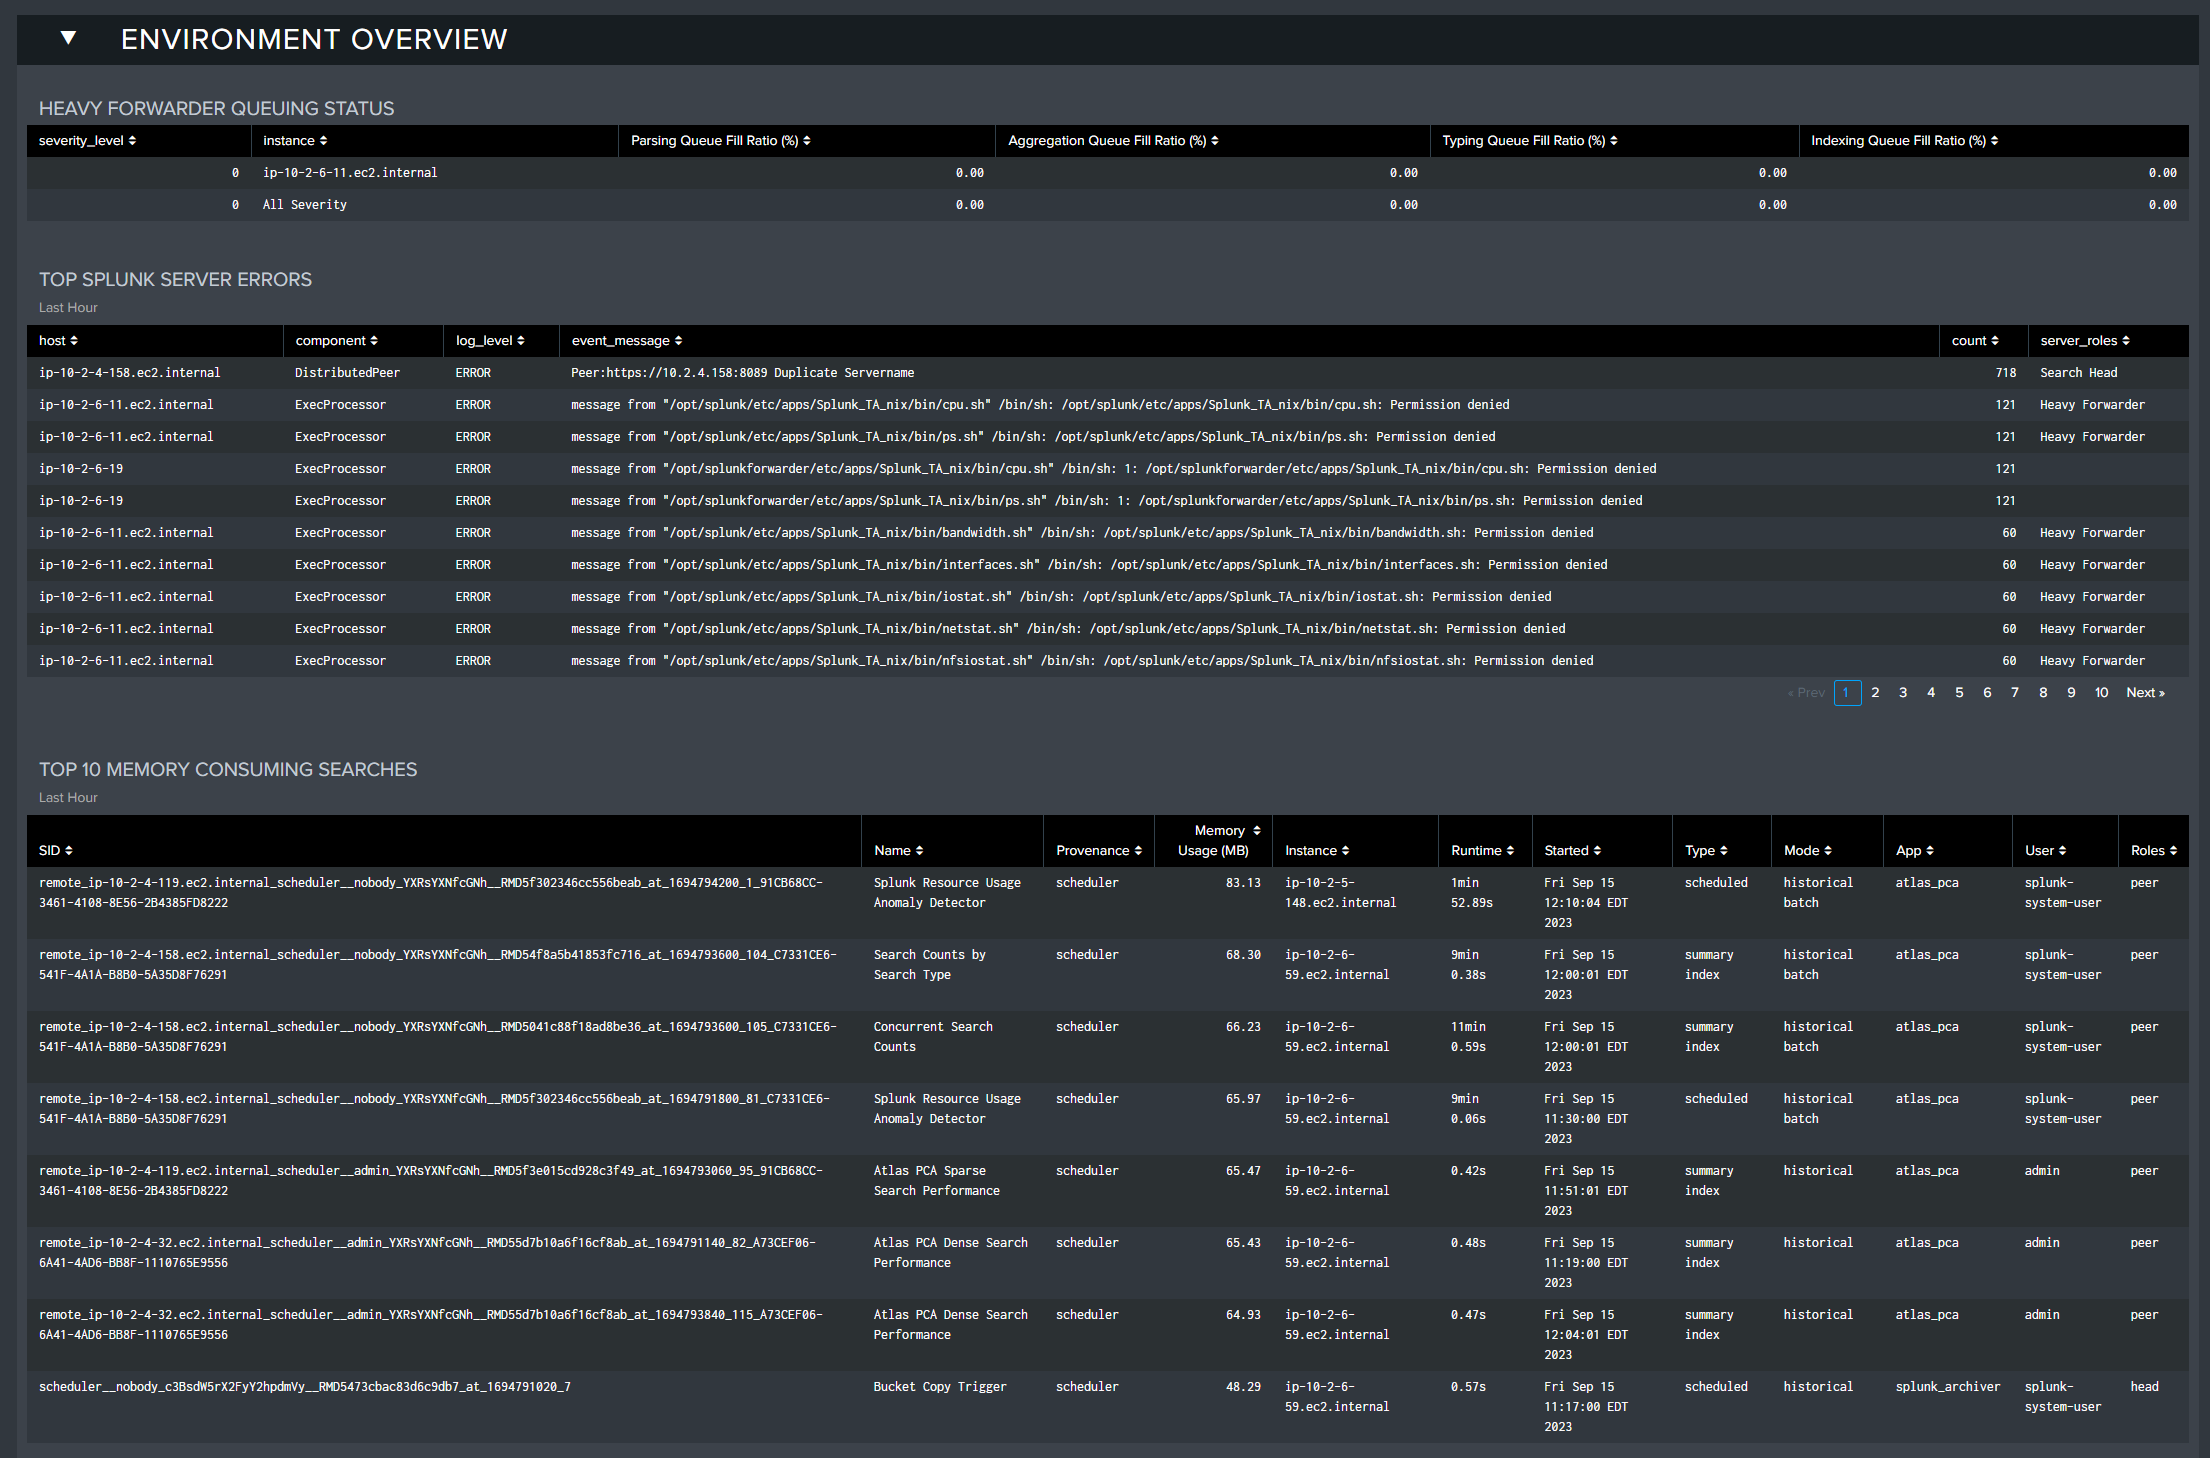
The Environment Overview section reports on a selection of errors across the environment, from Heavy Forwarder queueing issues, top memory consuming searches, and Splunk hardware information. This section is useful for fact checking the Splunk environment and ensuring no critical issues have been raised.
Heavy Forwarder Queuing Status: Displays the HF queuing status if detected
Top Splunk Server Errors: Shows the number of the top Splunk server errors in the last hour by server
Top 10 Memory Consuming Searches: The 10 searches consuming the most resources in the environment in the last 60 minutes
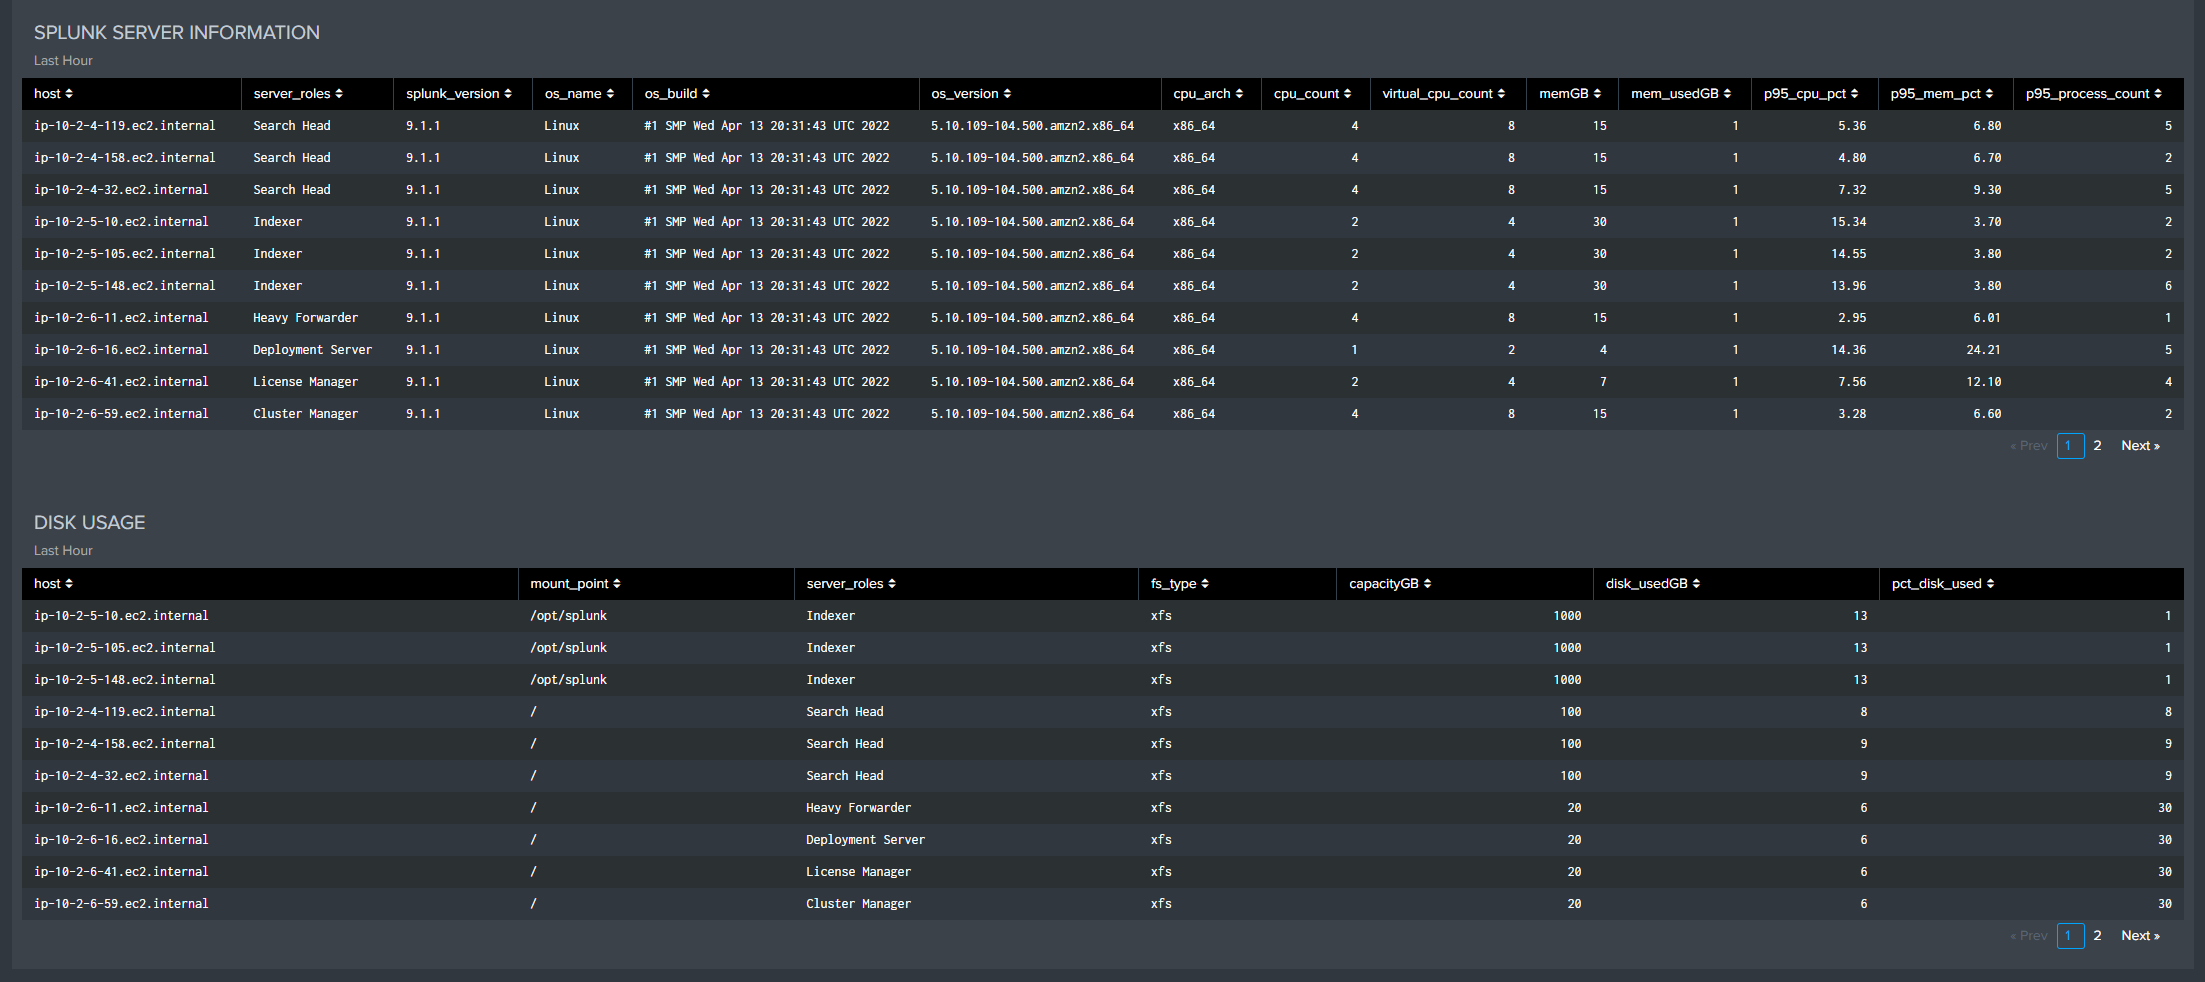
Splunk Server Information: Information about each of the servers in the environment from the last 60 minutes
Disk Usage: The disk usages measured by server in the last 60 minutes
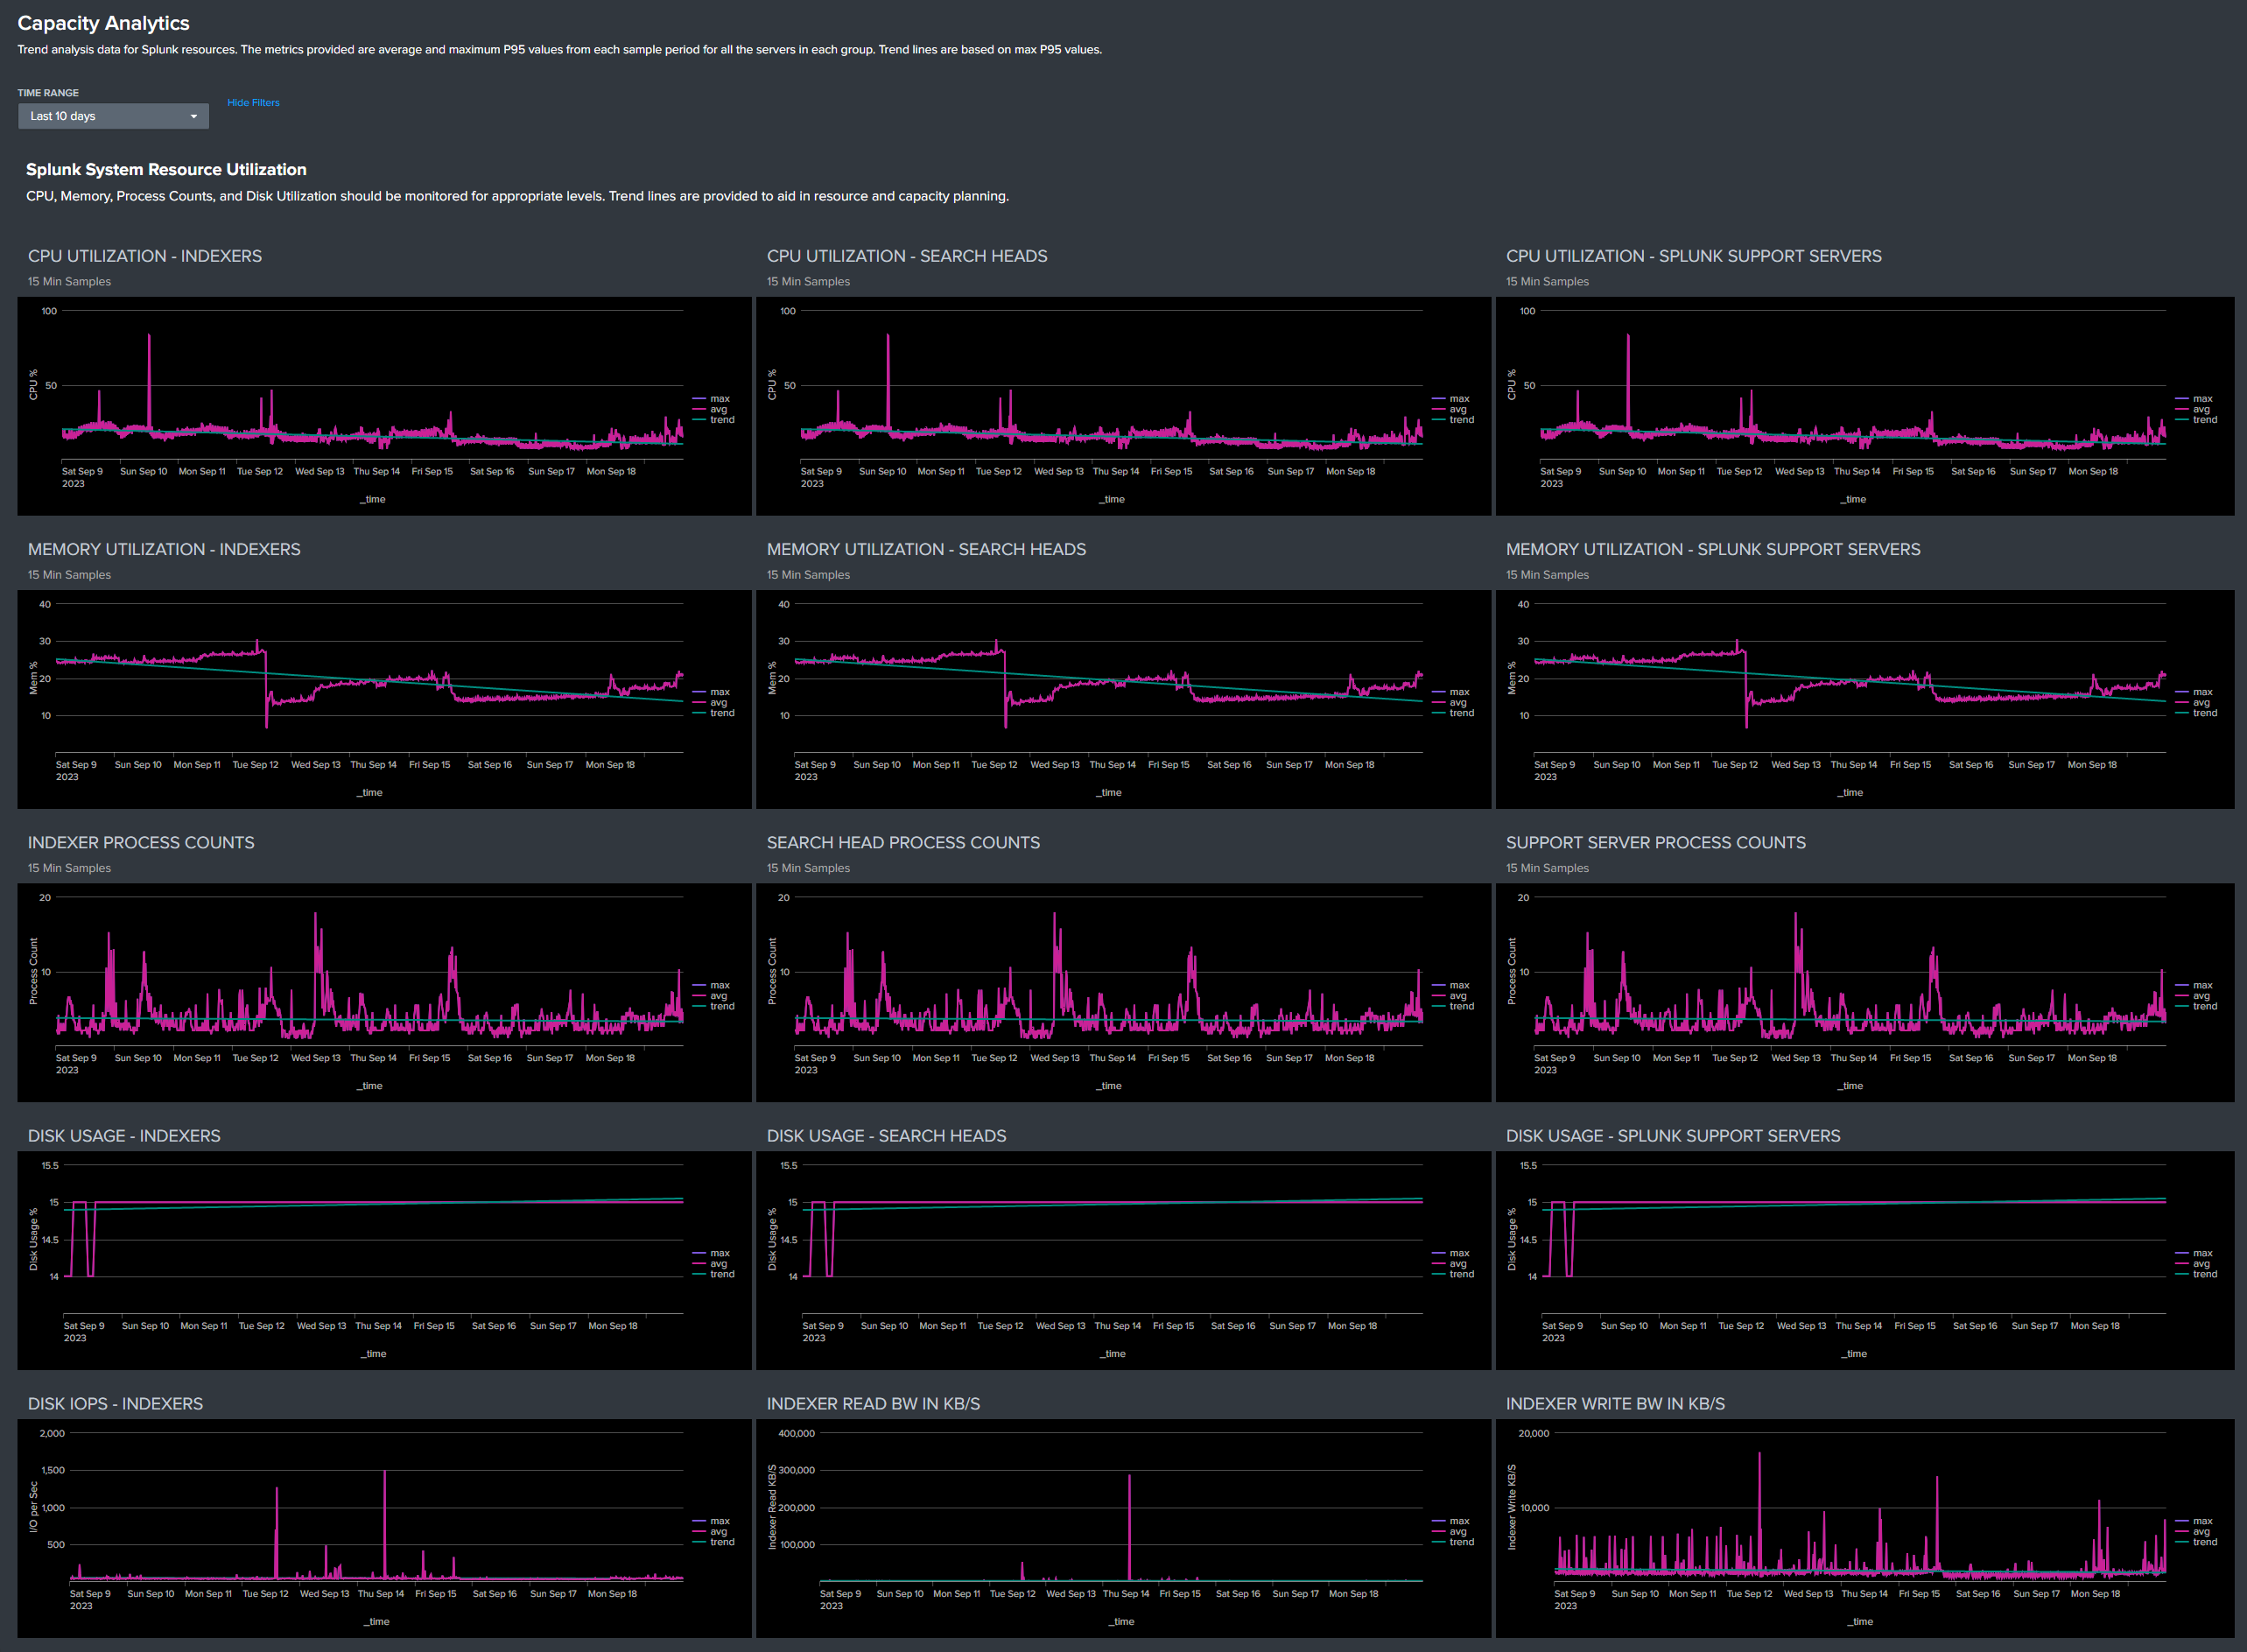
Capacity Analytics Dashboard
The Capacity Analytics dashboard provides trend analysis data for Splunk resources. This data is useful in troubleshooting scenarios for viewing typical resource usage patterns before an issue arose. And after Atlas PCA has been allowed to collect historical data for a sufficient length of time (90 days to six months, minimum) this data and the trend lines can be leveraged for projecting both Splunk resources (server hardware) and Splunk license usage requirements into the future. Of course, having more historical data will improve the accuracy of forward looking projections.
Note that the metrics reported in most of the graphs and tables are average and maximum 95th Percentile from the measured sample periods, in 15-minute increments, summarized across all of the servers in a group (Indexes, Search Heads, and Support Servers). Indexer and Search Head tiers typically handle a relatively balanced workload across all of the servers in their group, and workloads on the various Support Servers is fairly steady as well. Any significant deviations from 'normal' parameters and patterns seen in the Capacity Analytics dashboard can be isolated and investigated further from the System Resources dashboard.
The primary purpose of the Capacity Analytics data is to provide historical patterns and trending information. Knowing what is 'normal' for your environment, coupled with awareness of how resource usage and performance is trending is essential for ensuring a stable, performant Splunk environment.
System Resource Utilization
CPU, Memory, Process Counts, and Disk Utilization should be monitored for appropriate levels. Trend lines are provided to aid in resource capacity planning. Disk IOPS and R/W Bandwidth will typically reflect short term peaks, but sustained deviations from normal patterns should be investigated.
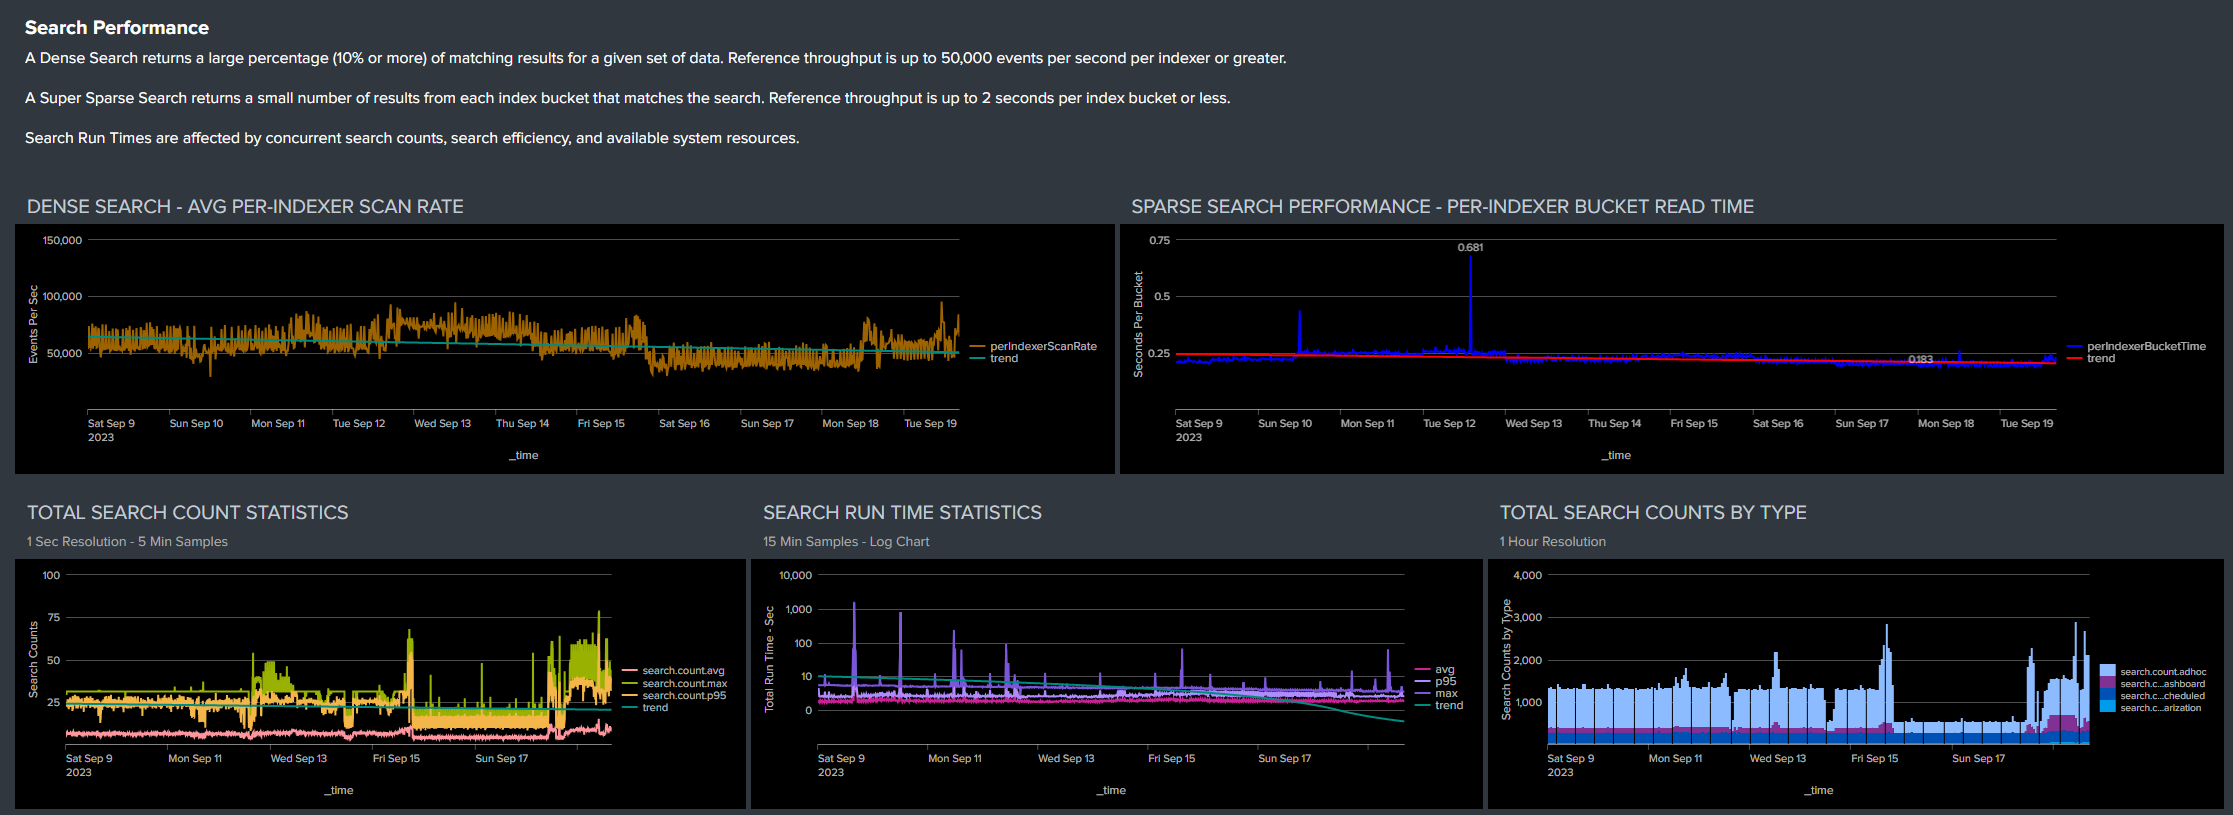
Search Performance
Search performance metrics are provided to allow monitoring of relative performance over time and correlation with any changes in the Splunk resource or user environments.
A Dense Search returns a large percentage (10% or more) of matching results for a given set of data. Reference throughput is up to 50,000 events per second per indexer or greater.
A Super Sparse Search returns a small number of results from each index bucket that matches the search. Reference throughput is up to 2 seconds per index bucket or less, per indexer.
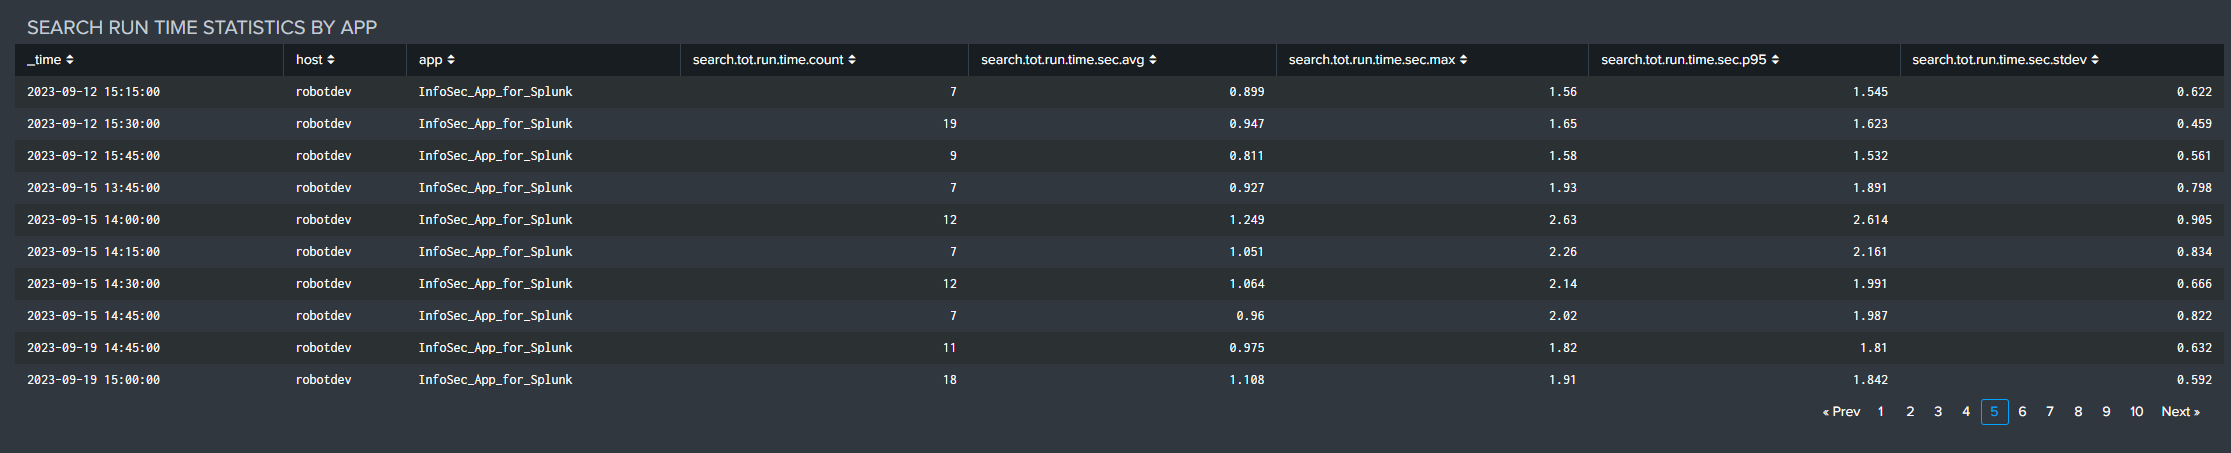
Total Search Count Statistics are provided in 5-minute average, maximum, and 95th Percentile counts based on 1-second samples to allow characterization of both peak and nominal search loading. Total Search Counts By Type and Search Run Times reflect and are affected by concurrent search counts, search efficiency, and available system resources.
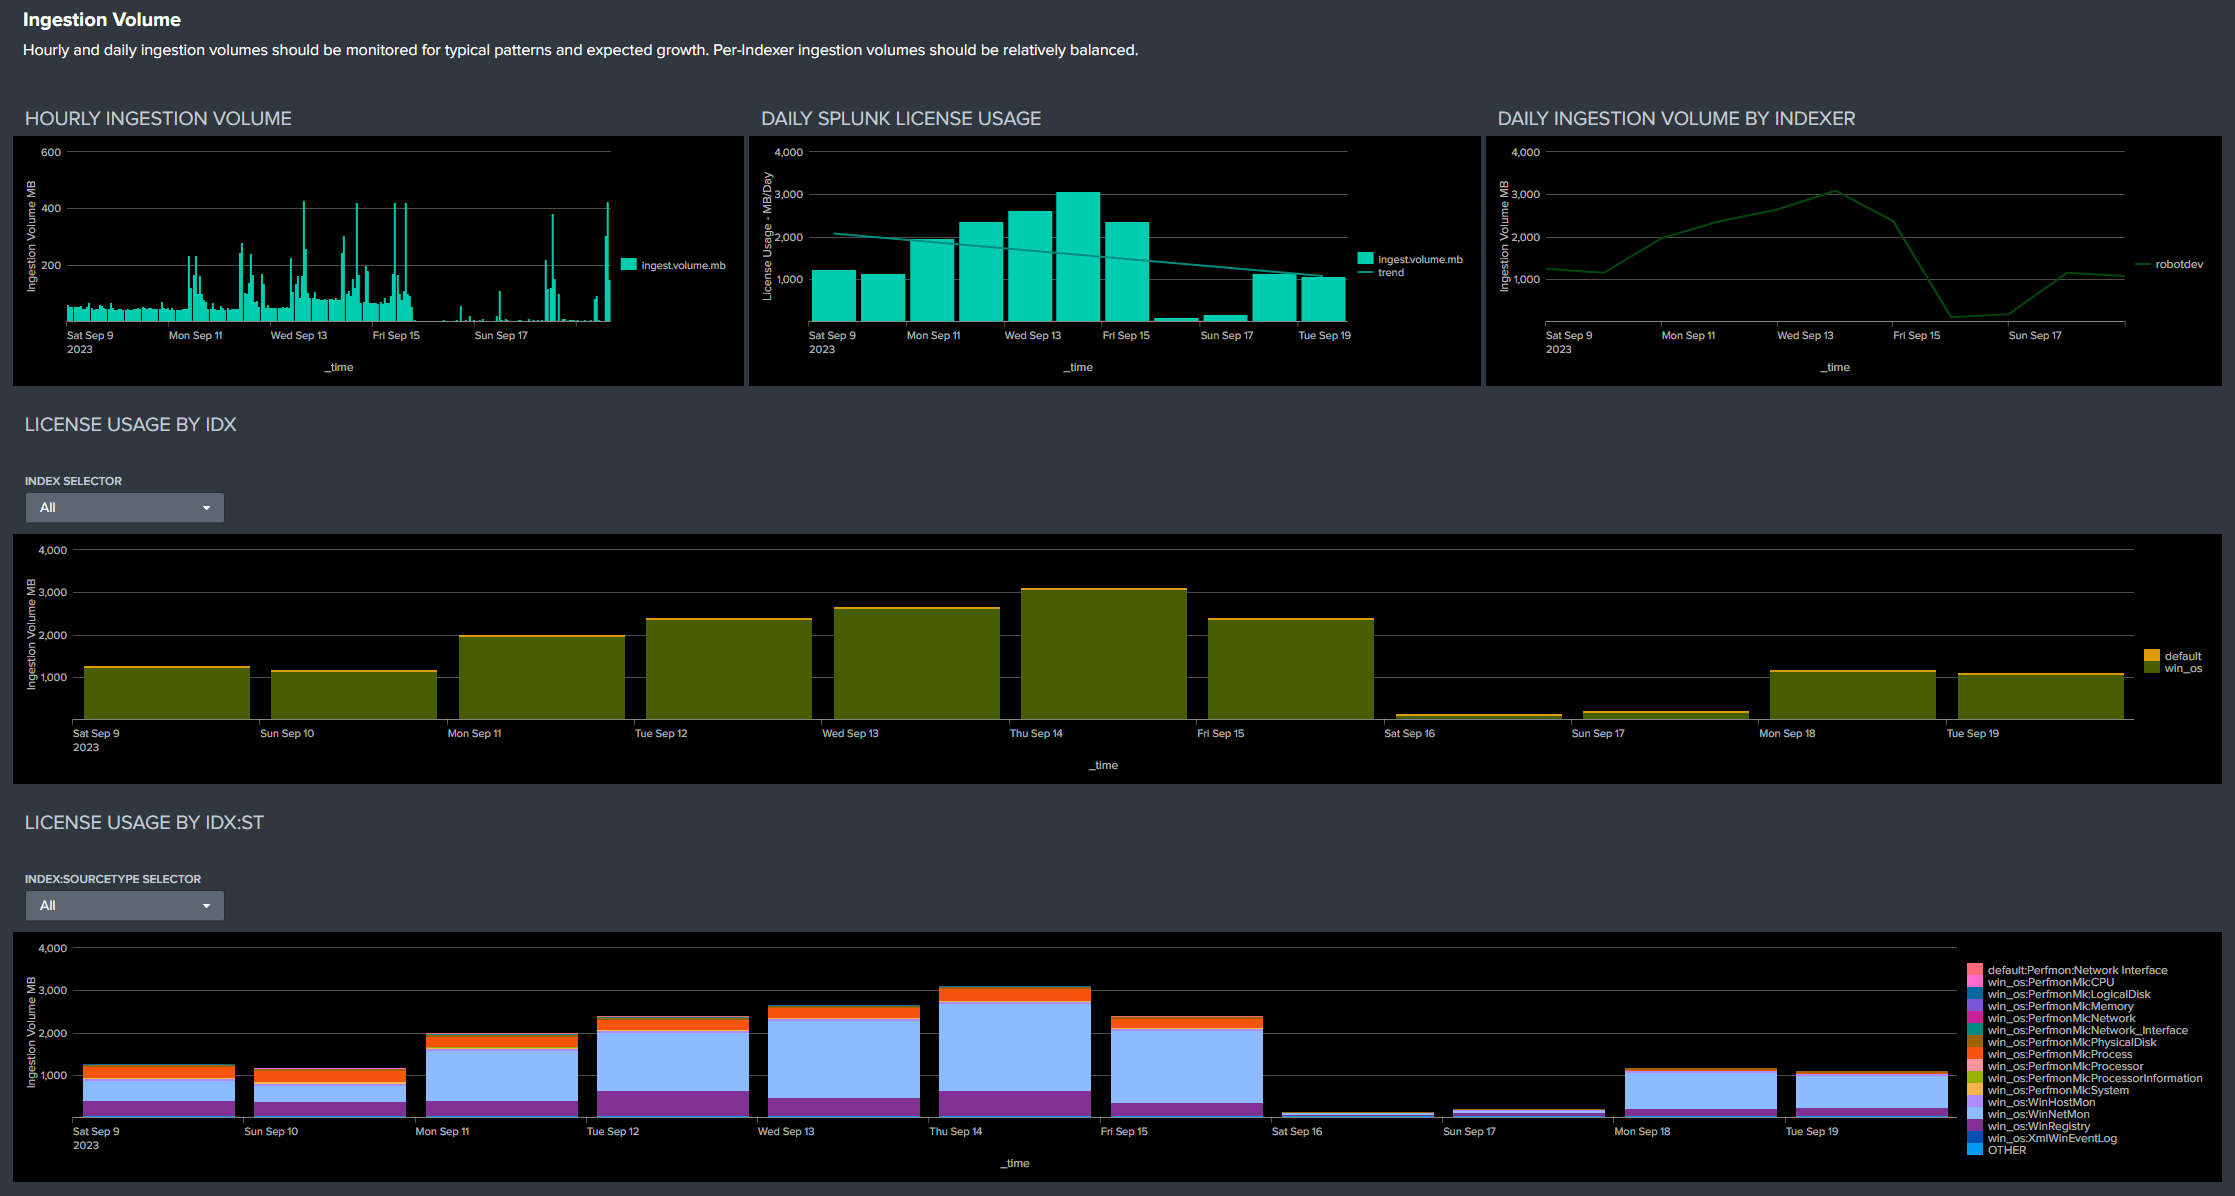
Ingestion Volume
Hourly and daily ingestion volumes should be monitored for typical patterns and expected growth. Per-Indexer ingestion volumes should be relatively balanced.
License usage by Index and Index:Sourcetype can be reviewed for expected volumes and unexpected changes.
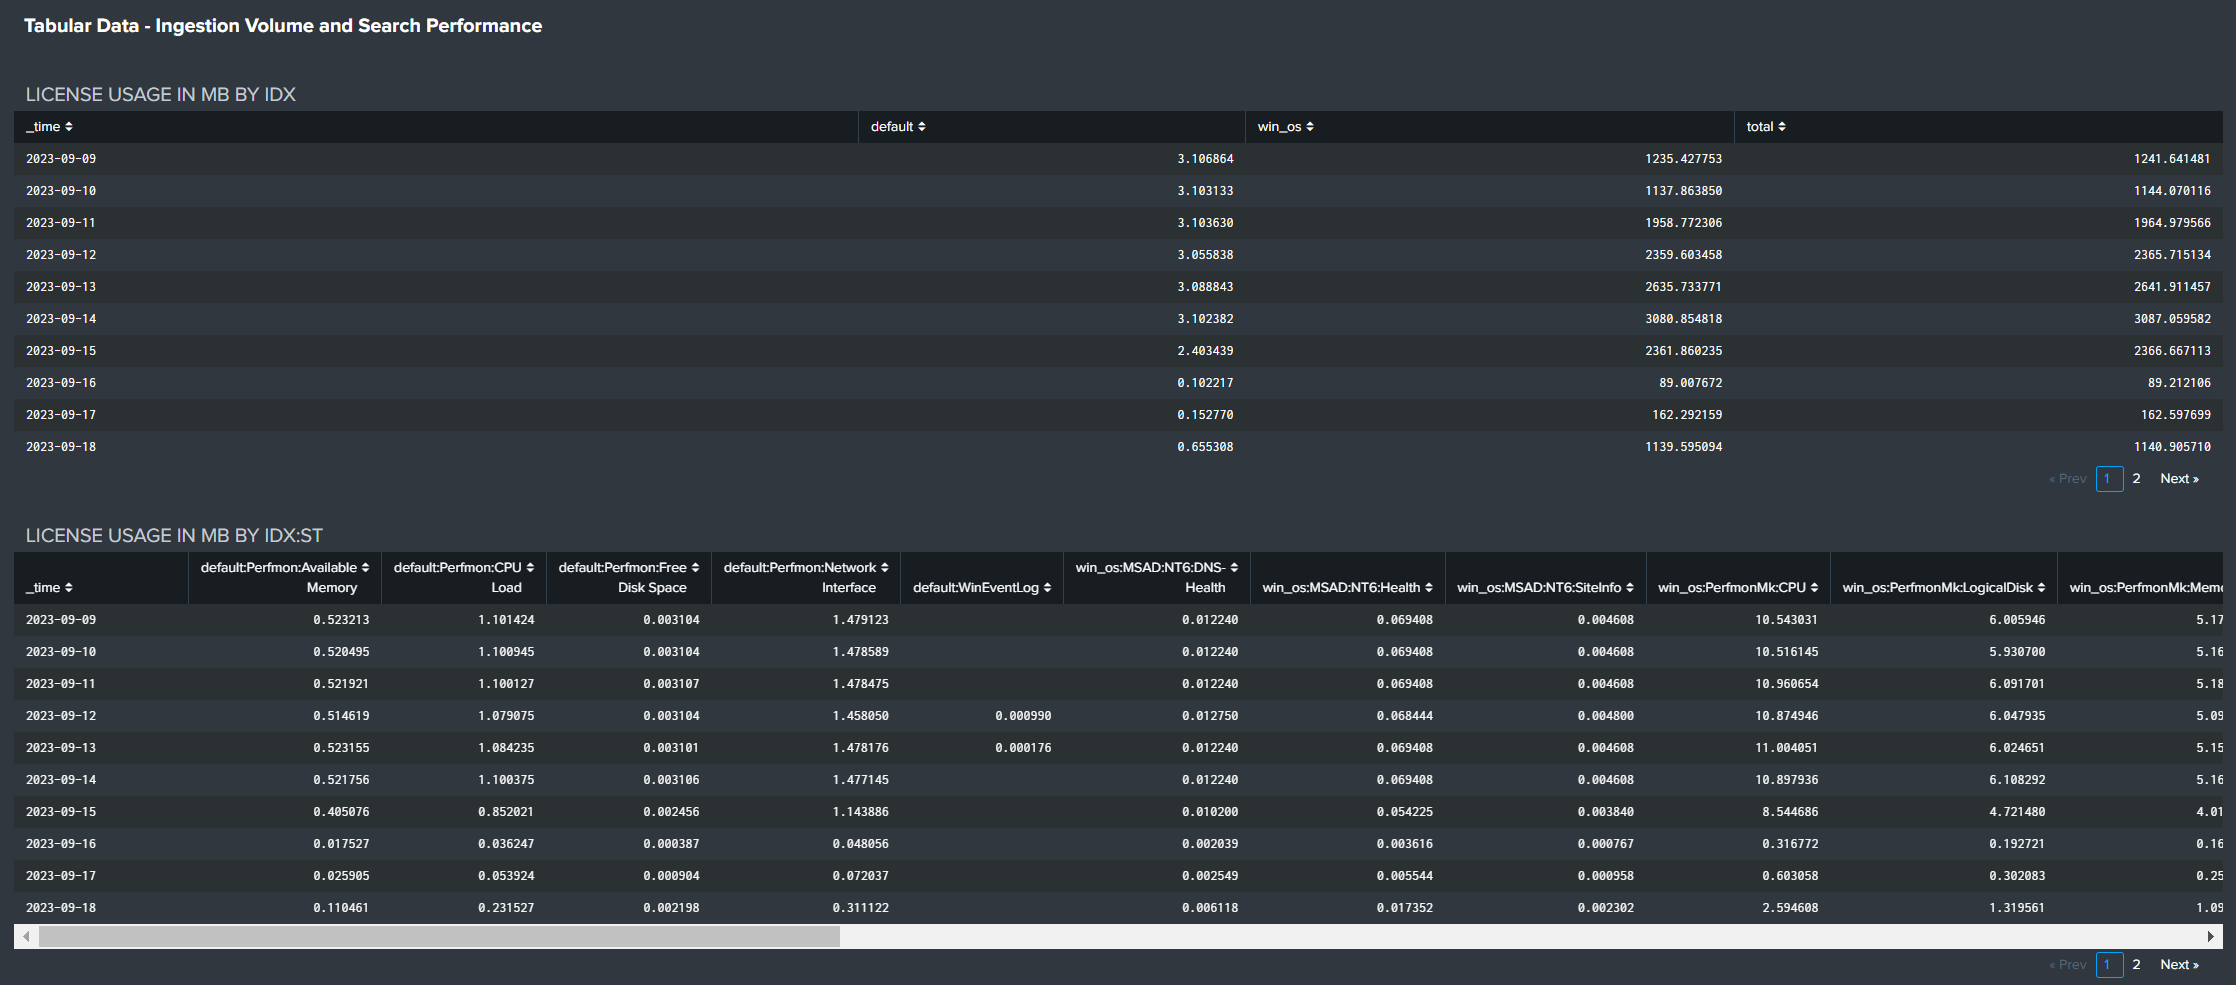
Tabular Data
Tabular license usage data can be exported for statistical analysis that supports accurate capacity planning based on real, historical data, as well as light charge-back activities.
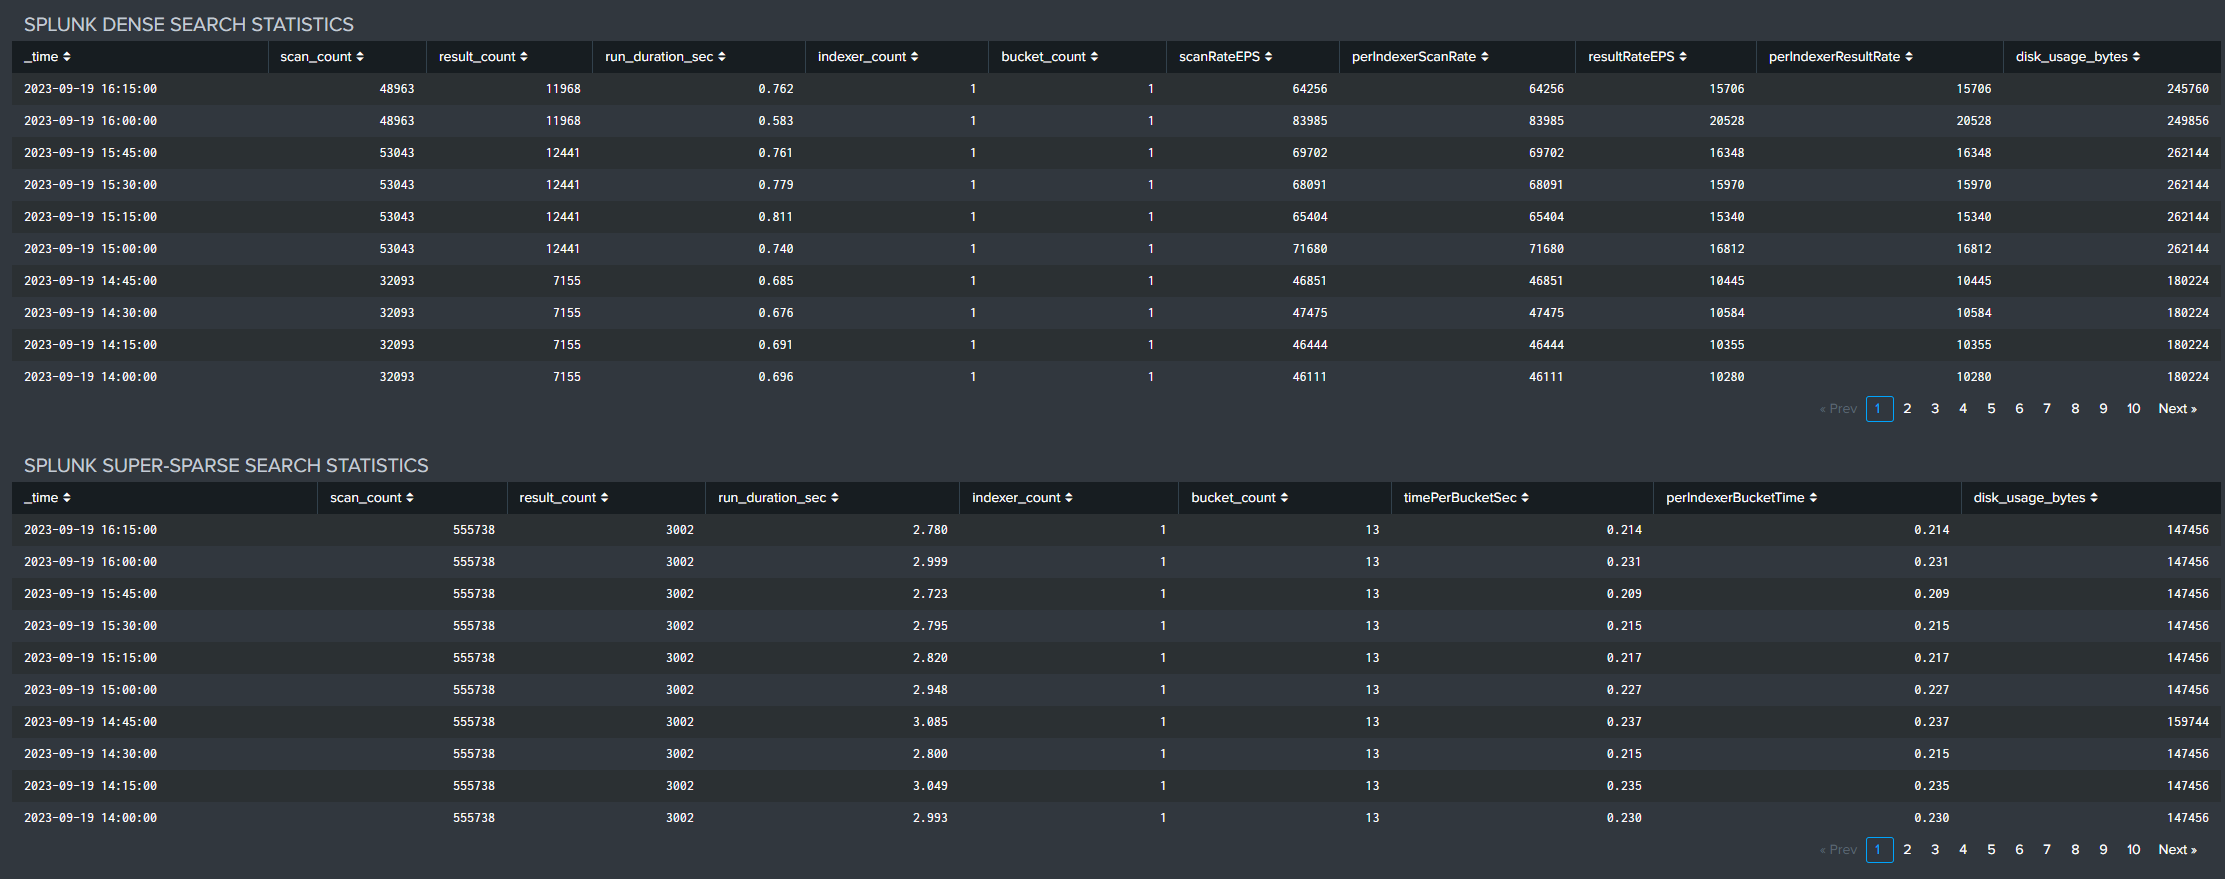
Tabular search statistics can be reviewed and exported for more detailed analysis if desired.
Tabular search run time statistics by Splunk app over time can be reviewed and exported for detailed performance analysis.