Using Data Utilization
Configuring Data Utilization
To use Data Utilization you must first perform some configuration steps in your Splunk environment. Data Utilization requires that two new metric indexes are created for the Element to use during operation. You will need to assign a metric index for tracking both license usage data and utilization metrics data. You can use existing metric indexes that you already have created, but it is recommended that you assign dedicated indexes to each data type for the best performance. These must be created in Splunk prior to proceeding to the next step. The license usage data metric index is the same index utilized by Forward Awareness. This enables both elements to function while preventing duplicate resources, however, changing the index selected will change the selection in both elements, impacting both Forwarder Awareness and Data Utilization.
The Configuration page in Data Utilization is used to help you see if you have met all of the requirements for the Element to function properly. Navigate to the Configuration page where you will find two sections. The Requirements section has automated checks that will indicate if Data Utilization is configured correctly. The Settings section has controls that help you configure the Element.
To configure Data Utilization follow these steps:
- Following your local Splunk policies and procedures, create a metric index for license usage data. Be sure that the Data Utilization Element has access to that index.
- Following your local Splunk policies and procedures, create another metric index for utilization data. Be sure that the Data Utilization Element has access to that index.
- Navigate to the Configuration page of the Data Utilization Element and scroll down to the Settings section.
- Assign the index that you created for license usage to the License Usage Metrics Index by selecting it from the dropdown.
- Assign the index that you created for utilization data to the Data Utilization Metrics Index by selecting it from the dropdown.
- Click the Save Changes button to complete the configuration.
- You are now ready to perform a Backfill Data operation if you want to track historical data.
Requirements
Use the Configuration page of Data Utilization to see if your Splunk environment meets the requirements for proper operation.
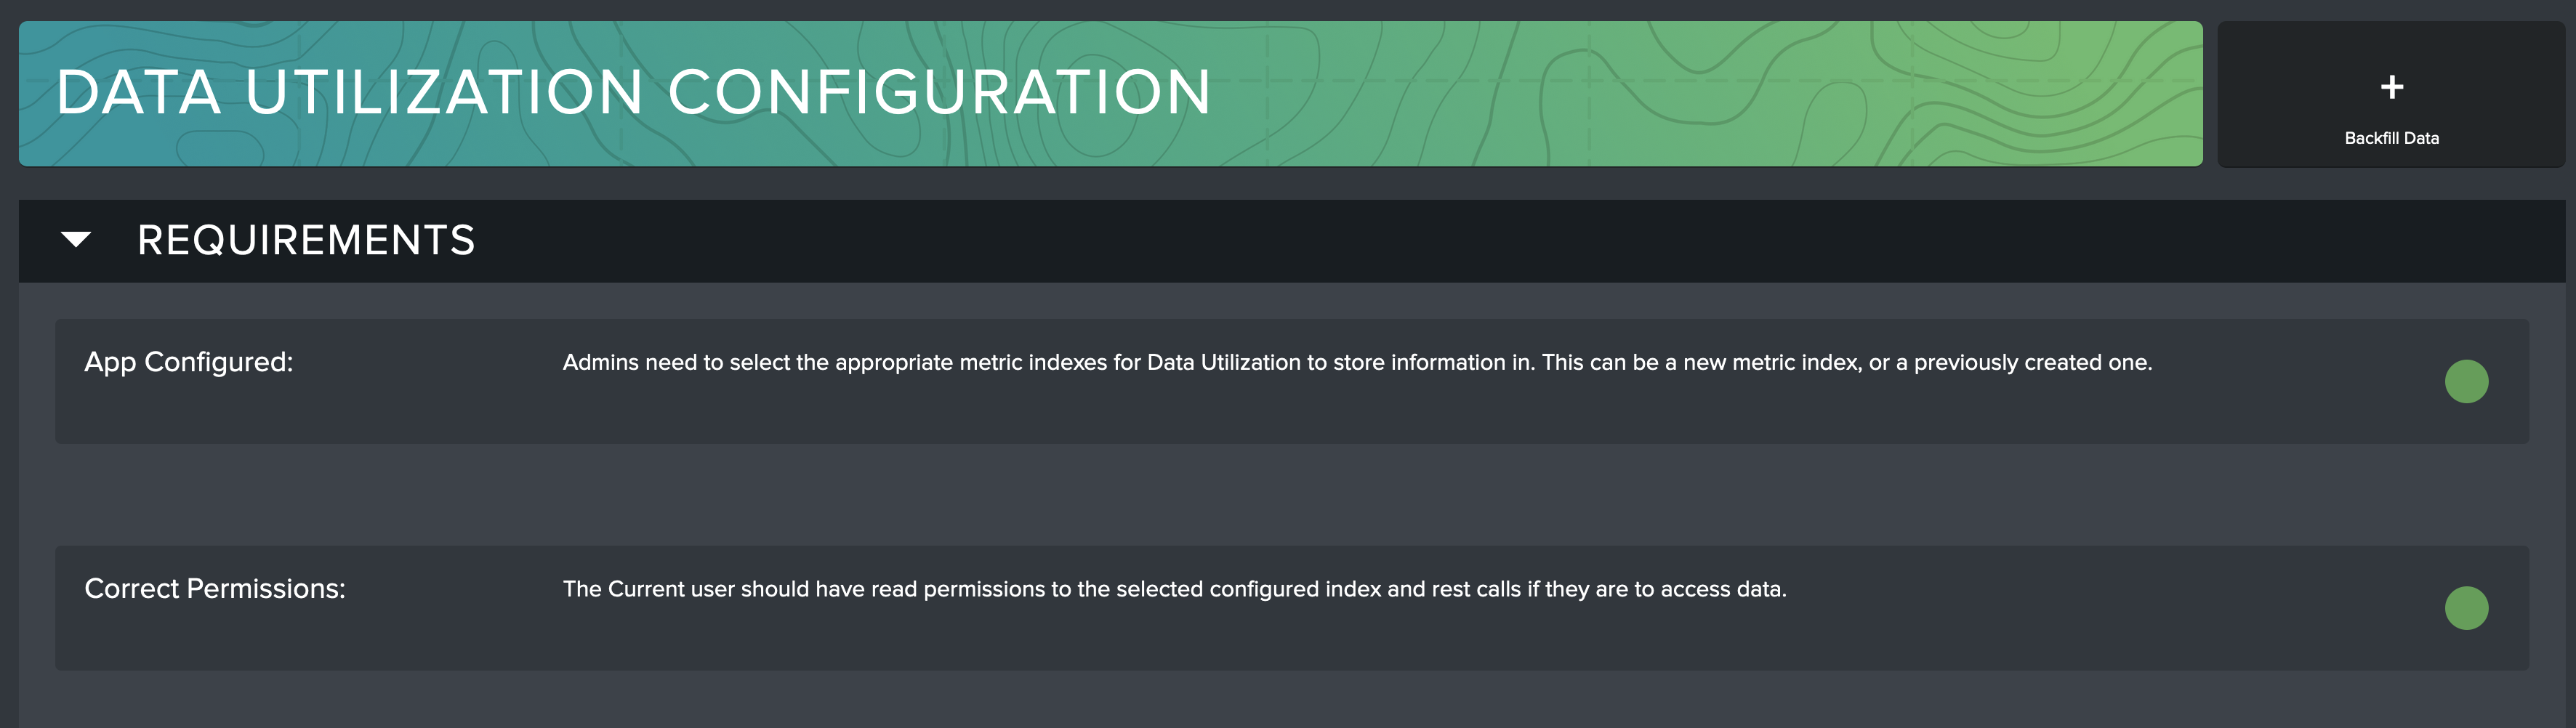
The requirements for proper Data Utilization operation are as follows:
- The metric indexes need to be selected for the Element to use during operation.
- The user must have read permissions to the selected metric indexes and the required Splunk APIs so that the Element will function properly.
If these requirements are not met, the Element will display a red ball icon on the Configuration page next to the check that needs attention. Guidance will be provided on the screen to assist with meeting the requirement.
Settings
Use the Configuration page of Data Utilization to configure the app to work in your environment.
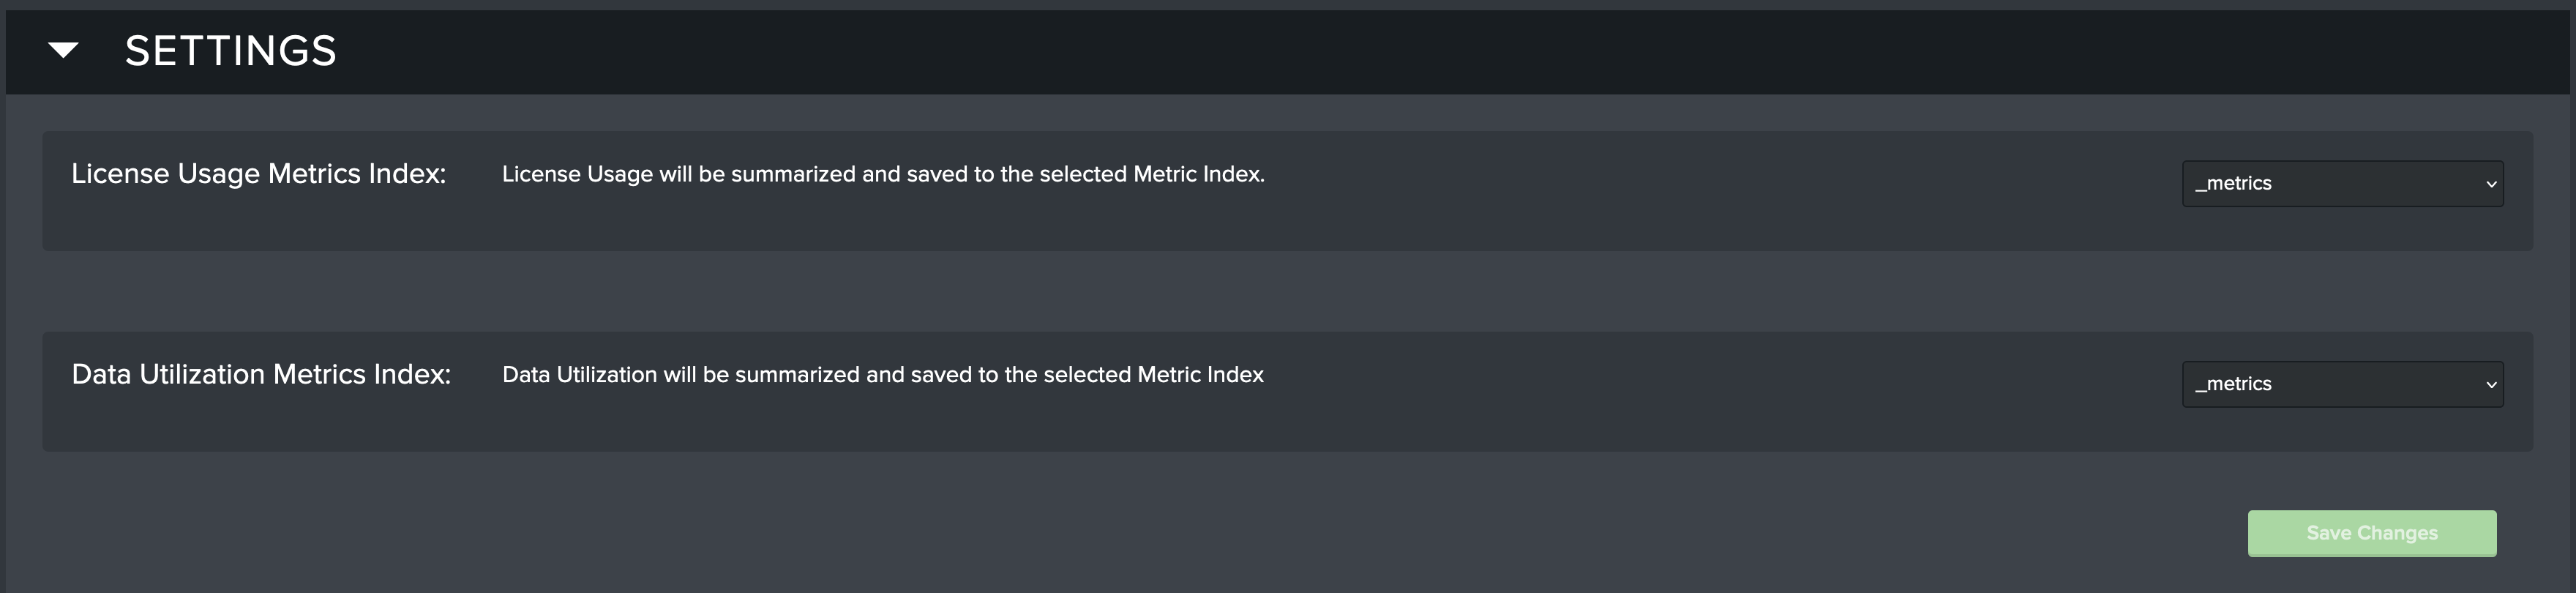
The following settings must be set for proper Data Utilization operation:
- License Usage Metrics Index: Select the metric index that will be used by Data Utilization to store license usage data.
- Data Utilization Metrics Index: Select the metric index that will be used by Data Utilization to store utilization data.
Backfilling Historic Utilization Data
By default, Data Utilization will track only utilization that occurs after the Element has been configured. To capture and review historic utilization preceding app configuration a backfill operation must be executed. It is recommended to perform these steps when the Splunk Environment is not experiencing heavy usage. The backfill process works by queuing up searches that are executed in the background that will populate the metric indexes selected on the configuration page.
The Data Utilization Backfill feature is not currently available for Federated Search Head deployments

Once the metrics indexes have been configured, the Backfill Data button will appear in the top-right corner of the Configuration page. The Backfill Utilization Data modal will appear.
Choose how far back you wish to track historic utilization or license usage. It is recommended to start with a small time period to test your environment, and then expand when the results are validated.
Select the Search Time Range for each search. Smaller time ranges may execute better in larger environments.
Click the Calculate Backfill button when all options are set to the desired values.
The Backfill process will tell you if you need to run a backfill for the selected time range. If a backfill is not needed you will be notified of that and given a Back button. If a backfill is needed, you will be presented with a Start Backfill button. Click Start Backfill to begin the process.
The Backfill is now executing. You can wait this page for it to finish, or navigate away while it runs in the background. If you stay on the page when it completes (recommended) then you will receive a confirmation when it completes.
Once the process has completed, you can verify by going into Data Utilization and looking for utilization and license metrics in the time range that you ran the Backfill for.
After being configured, Data Utilization will start tracking utilization information every 5 minutes. Data Utilization will not show utilization that occurred before it was configured unless you perform a Backfill.
Investigating Utilization
To begin, there are selections at the top of the page to filter on dataset type, dataset, utilization time range, and license usage time range. Use these filters to isolate the resulting data to only what you are interested in.
The power of the Atlas Data Utilization Element is in it's ability to quickly identify underutilized datasets, analyze their usage, and accurately determine if that dataset should be discontinued to save on storage and license usage or, just as importantly, determine if that data warrants more attention because it offers organizational value that is not being extracted.
What types of utilization can and cannot be detected by Atlas Data Utilization?
For full accuracy, a search must return the
sourcetypefield in its results. For searches that do not contain this field, Atlas calculates a best guess. This guess is accurate in most cases.If the
index,sourcetype, orsourcefields of a search are contained within a macro or part of a data model search, Atlas is unable to identify this as utilization..
Splunk's internal logs are updated regularly throughout their history of releases. The older the Splunk version, the less granular the logs tend to be.
Prior to Splunk version 8.1, Atlas is unable to identify which dashboards queries were run against but only that they ran against a dashboard.
Prior to Splunk version 9.0, Atlas is unable to detect queries from Dashboard Studio 2.0 dashboards.
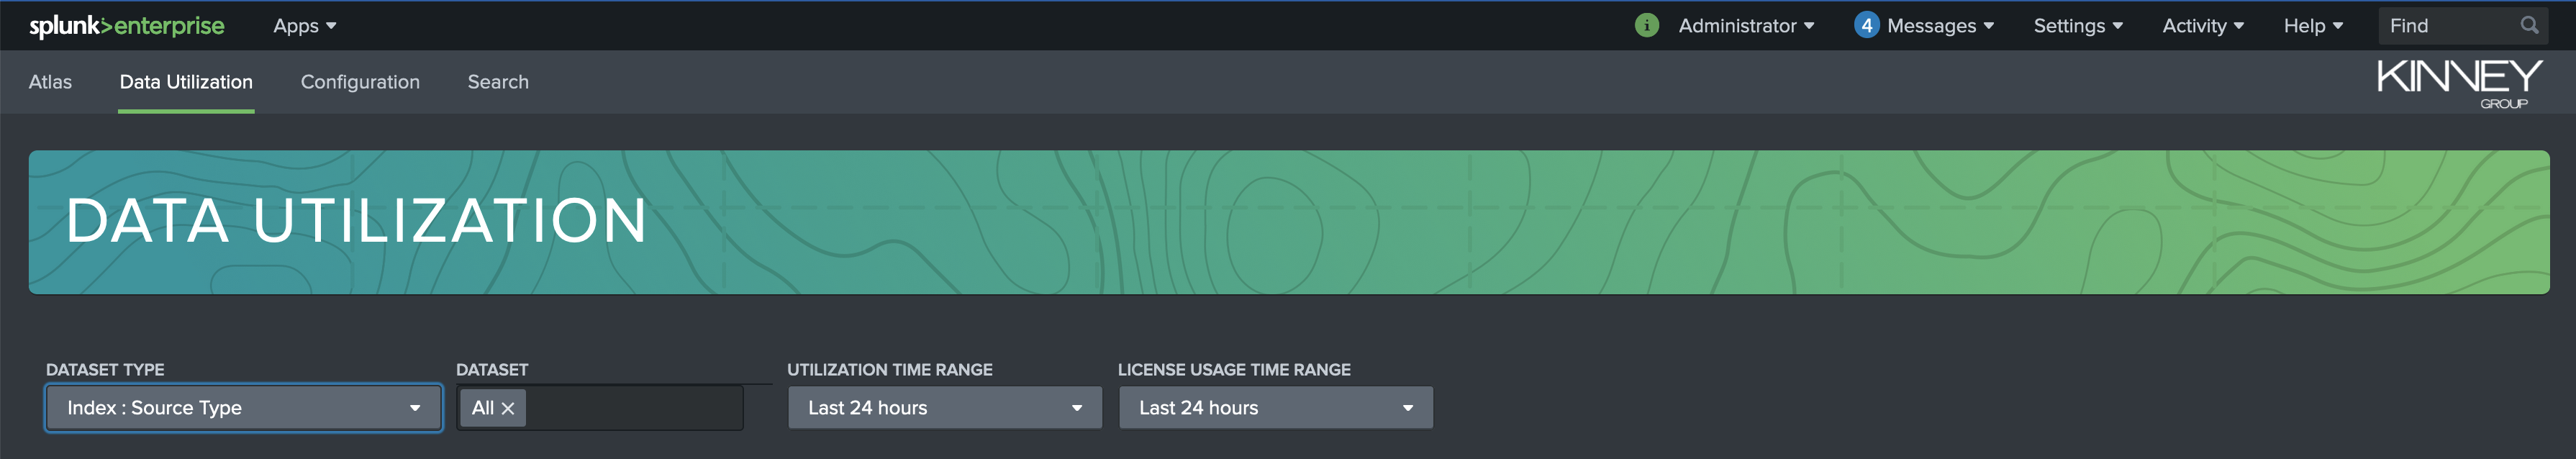
The filters available at the top of Data Utilization page impact the results of the entire page. The filter options are as follows:
- Dataset Type: Allows you to choose which level you want to view utilization metrics. The options are Index, Index:Source Type, Index:Source Type:Source.
- Dataset: Filters the results down to specific datasets. The default value is All.
- Utilization Time Range: The time range for which to calculate data utilization. The default value is 24 hours.
- License Usage Time Range: The time range for which to calculate license usage. The default value is 24 hours.
Key Metrics
Below the filtering options is the Data Utilization Key Metrics panel. This gives Admins a high-level overview of Data Utilization within their Splunk environment in the form of three Key Performance Indicators (KPIs) that provide comparative counts of underutilized datasets, and how much the Splunk license is under/over-utilized in both percentage and raw gigabytes.
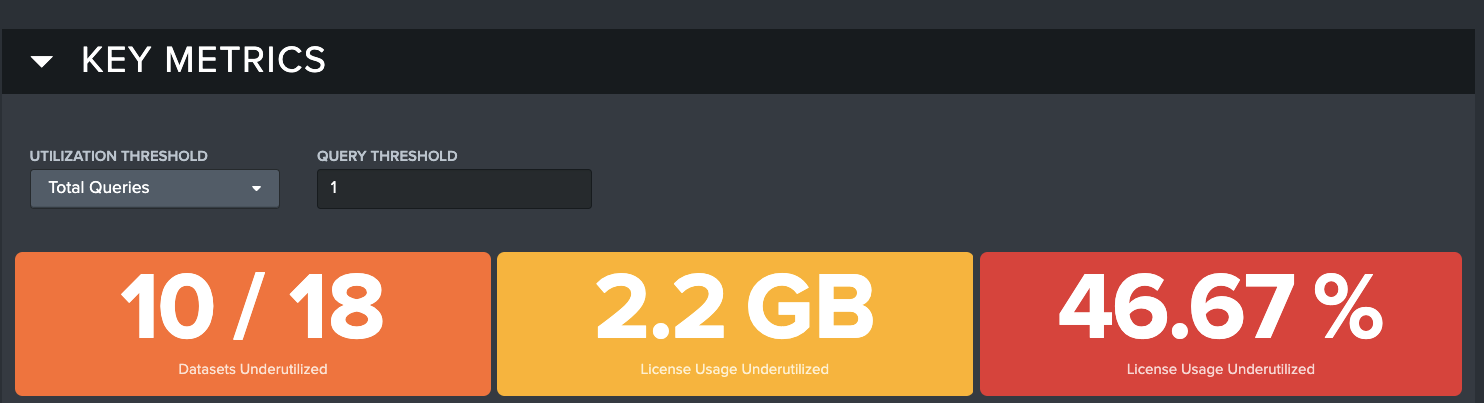
There are two ways to modify the view of the KPIs. The Utilization Threshold and Query Threshold filters can be used to modify the way the KPIs are calculated.
Utilization Threshold: Allows you to chose which dimension of utilization you want to see in the results. The options are Total Queries, Queries/Day, and Queries/10GB. This field is used in coordination with the data input field that is next to it.
- Total Queries includes all queries run against a data set within the selected time range
- Queries/Day bases the determination of underutilized on the number of queries per day
- Queries/10GB bases the determination of underutilized on the number of queries per 10GB of license usage
Query Threshold: Allows you set a threshold value that makes sense for your use case. The default value is 1, but you can change it to any number that you want. For example, if you decide that 10 Total Queries in a time period is your ideal threshold to identify an underutilized dataset, the KPIs will adjust to show you anything under 10 total queries in the selected time range.
There are 3 KPIs that are included in the Key Metrics section. Each KPI in the Key Metrics section is based on the options chosen in the Dataset Type, Utilization Threshold, Query Threshold, and the selected time ranges. The purpose of each KPI is described as follows:
Datasets Underutilized: Displays how many datasets fall into the underutilized category based on the selected options.
License Usage Underutilized (GB): Displays how much of your license usage in GB is considered underutilized based on the selected options.
License Usage Underutilized (%): Displays the percentage of your license usage is considered underutilized based on the selected options.
A practical example for how to interpret the results that are displayed in Data Utilization?
- The Dataset Type would be set to Index
- The Dataset would be set to the default value of All
- The Utilization Time Range would be set to Last 30 Days
- The License Utilization Time Range would be to Last 30 Days
- The Utilization Threshold would be set to Total Queries
- The Query Threshold would be set to 10
The results will show you the following:
- Datasets Underutilized will show you the number of indexes underutilized out of the total number of indexes found in your environment.
- License Usage Underutilized(GB) will show you the total amount data in GB that is underutilized.
- License Usage Underutilized (%) will show you the percentage of your license usage that is underutilized.
Utilization Overview
The Utilization Overview panel displays utilization by dataset. These results show the total number of ad-hoc, scheduled, and dashboard queries within the selected time frame. It also shows the amount that the queries contribute to your license utilization. The license utilization values are color coded so users can quickly identify datasets that are consuming license but are not being searched very often. Administrators might want to consider deprecating this data, or seek to increase utilization to get more value from the data - effecting optimal use of resources.
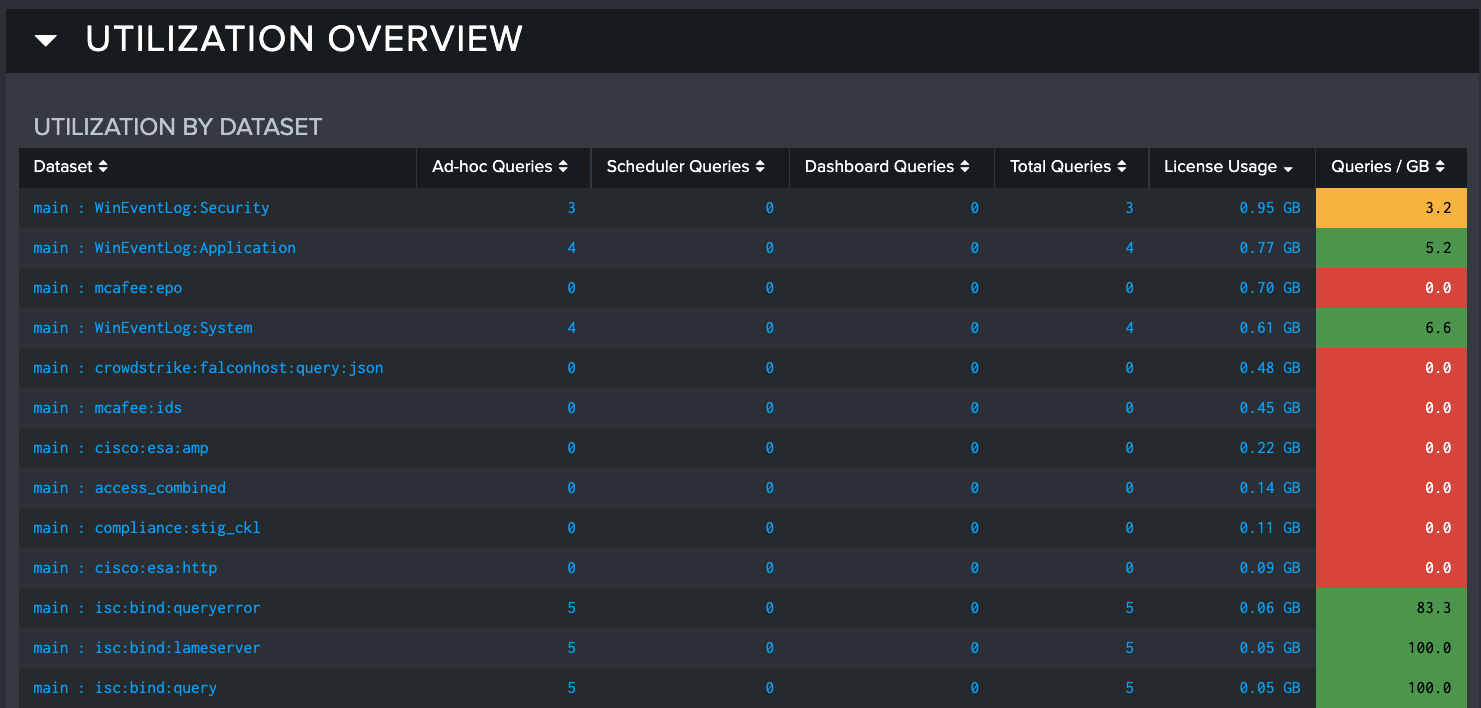
The Utilization by Dataset table provides results to show how data is currently being searched in three different categories:
- Ad Hoc Queries: This column shows the number of times this dataset has been included by any user using Splunk to execute a search
- Scheduled Queries: This column shows how many times a dataset was searched by Scheduled Searches
- Dashboard Queries: This column shows how many times a dataset was searched by queries built into dashboard panels
- License Usage: The amount of license in GB that is being used by the dataset
- Queries/GB: A ratio from the number Splunk queries executed per GB of license consumed by the dataset
The Utilization Overview section is concluded by three visuals that show the data distribution of the three types of queries that are tracked by Data Utilization.
In the Utilization by Dataset table, you can select an item that you would like to investigate further. Once selected, the bottom half of the dashboard will populate with more detailed information about the selected item.
Investigating Queries
After selecting a specific dataset that you want to investigate further, the Investigating Queries panel will appear below the Utilization Overview section. Here, you can inspect the queries being executed against the selected dataset in detail.
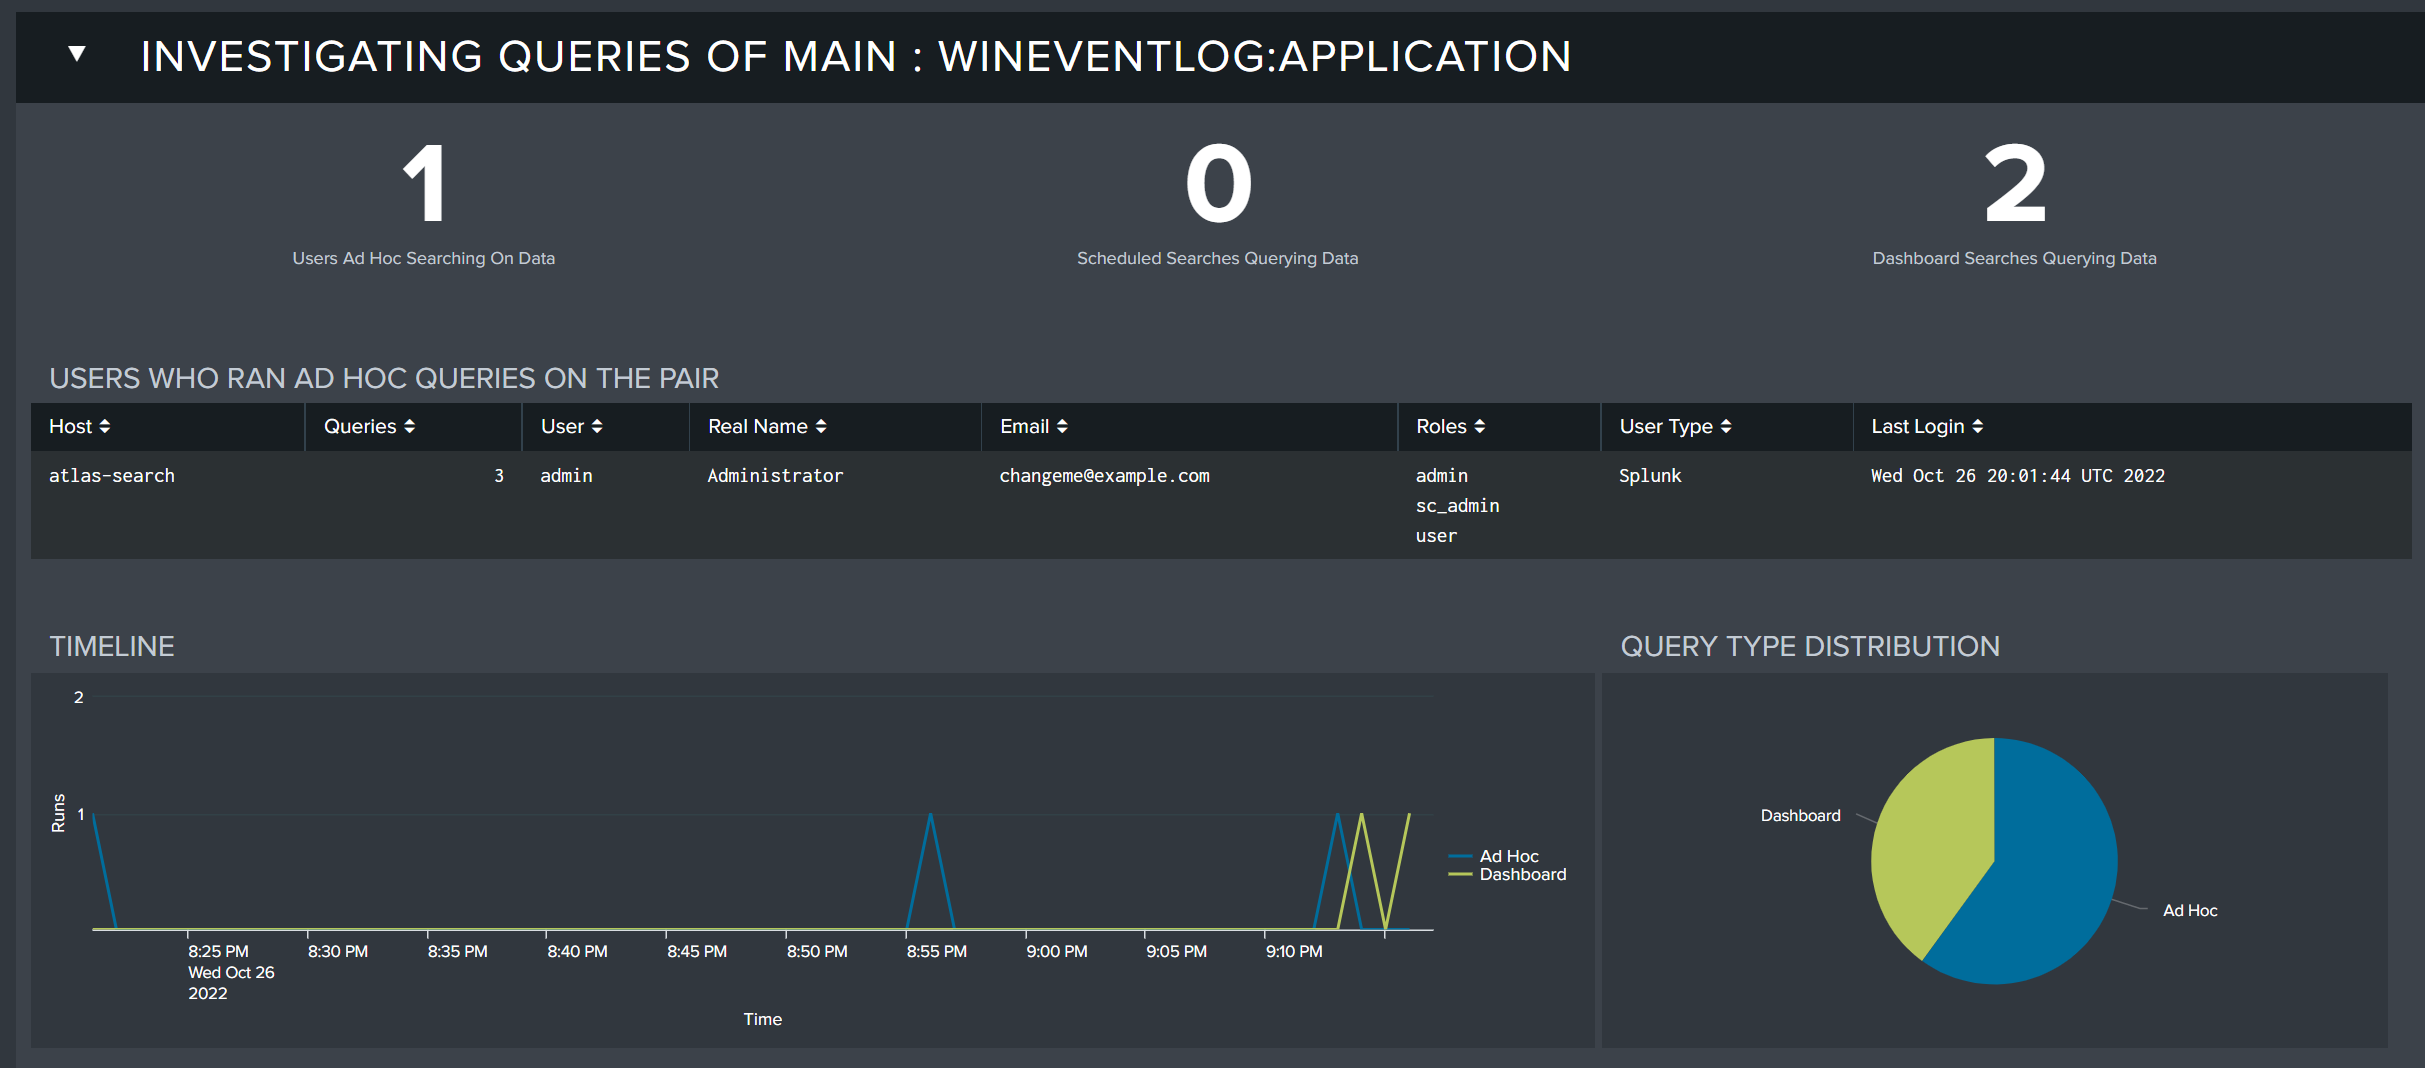
The query investigation section contains the following information:
- Users Ad Hoc Searching On Data: The number of users performing ad-hoc searches against the selected dataset
- Scheduled Searches Querying Data: The number of scheduled searches querying the selected dataset
- Dashboard Searched Querying Data: The number of dashboard searches querying the selected dataset
- Timeline: A timeline visual that shows the types of queries executed against the selected dataset over the selected time range
- Query Type Distribution: Shows the distribution of query types executed against the selected dataset over the selected time range
Clicking on the numeric value for Users Ad Hoc Searching on Data, Scheduled Searches Querying Data, and Dashboard Searches Querying Data will cause a table to appear that shows a corresponding list of items that were discovered to have been utilizing data in the selected time range.
The last component of the Investigating Queries section is a table that shows the Splunk searches that ran against the data being investigated. This table is helpful in determining exactly which activity is taking place on a dataset so that you know exactly the type of activity that is taking place.
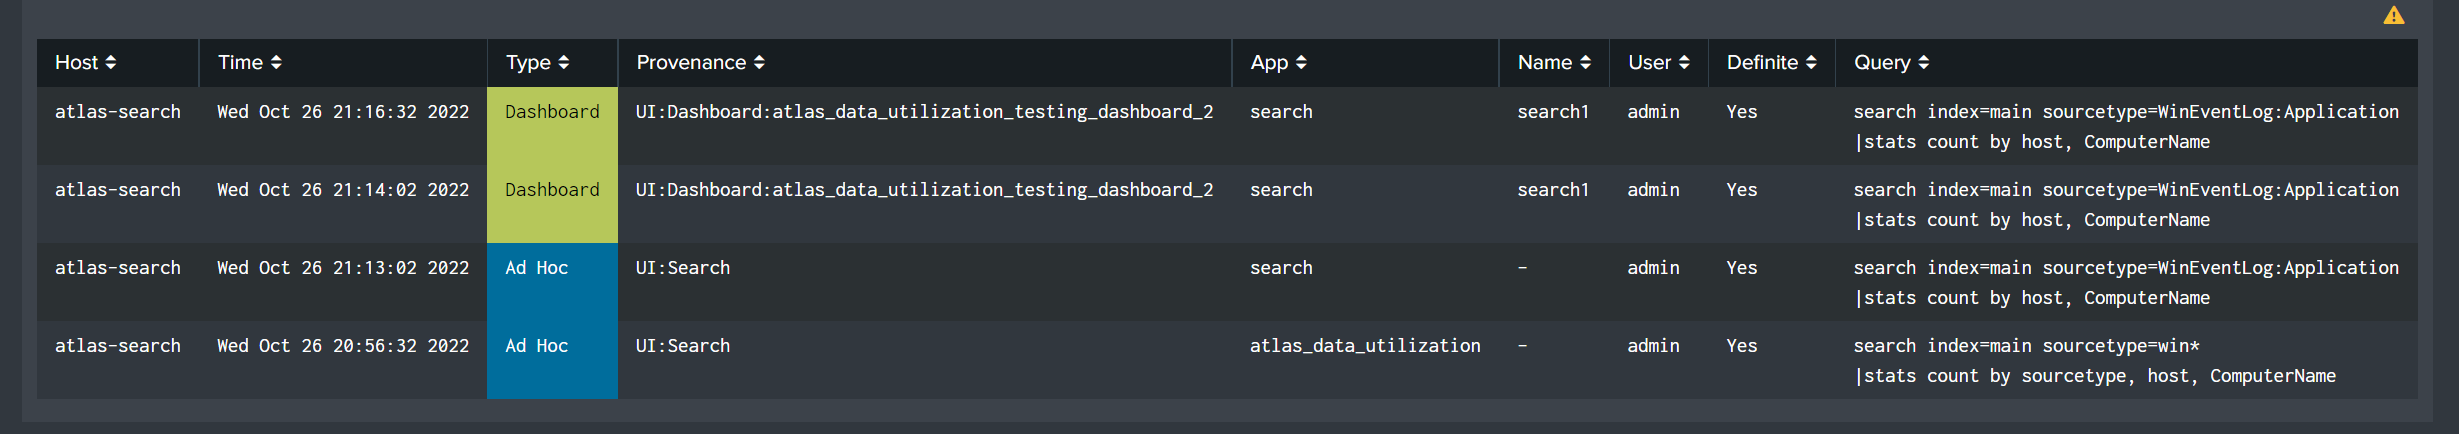
This table contains the following fields:
- Host: The host where the search was executed from.
- Time: The time that the search was executed.
- Type: The type of search it is (Dashboard, Ad Hoc, Scheduled)
- Provenance The provenance
- App The App that search was run from.
- Name The name of the search.
- User The user that ran the search.
- Definite (Yes/No) If a search's results include the sourcetype field, the log will list which specific source types have been queried. For searches which lack this information, Atlas evaluates the SPL to determine which datasets have been queried. A query is definite if Atlas can determine the index and sourcetype from the SPL.
- Query The SPL of the actual query.
Investigating Fields
The Investigating Fields panel provides a table of all the fields found in the selected dataset, the type of field, statistical metrics, and how often each field was utilized in the three types of searches analyzed. This information is important so that you can understand the fields being searched and what types of searches they are being included in.
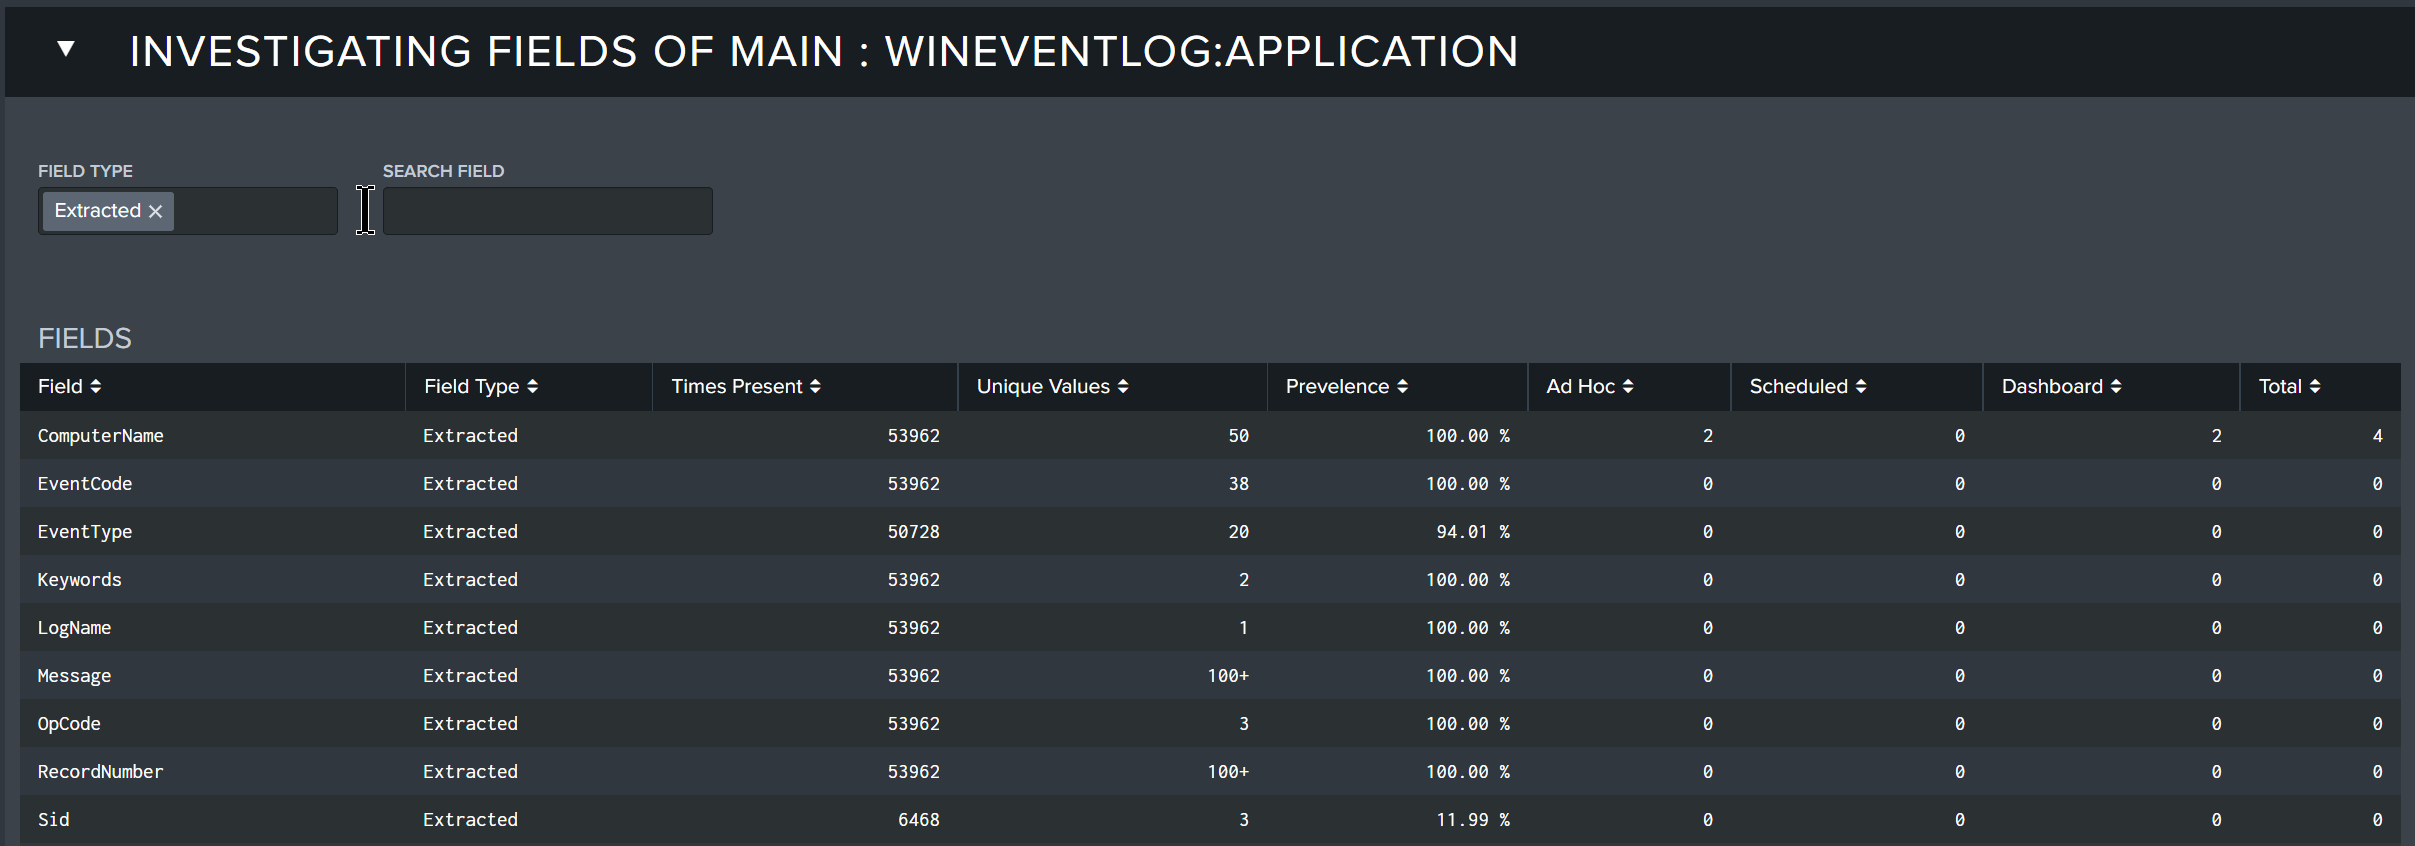
The Fields table contains the following fields:
- Field: The field name included in searches.
- Field Type: The type of field that it is.
- Times Present: The number of times the field was present in the searches.
- Unique Values: The number of unique values presented in the search for the field.
- Prevalence: The prevalence of the field.
- Ad Hoc: The number of times the field appeared in an Ad Hoc search in the selected time range.
- Scheduled: The number of times the field appeared in a Scheduled search in the selected time range.
- Dashboard: The number of times the field appeared in a dashboard query in the selected time range.
- Total: The total number of occurrences of the field appearing in any type of search.