Using Data Management
What is Atlas Data Management?
The Atlas Data Management Element provides you with two primary capabilities. First, you can inventory, define, and manage all of your data that you having coming to into Splunk in order to understand its impact to your business. Second, Data Management provides you with a workflow management tool that allows your users to request adding new data to Splunk. This document describes the capabilities included in the Atlas Data Management Element.
Data Inventory Dashboard
A Data Inventory dashboard provides an inventory list of all of the active data flows coming into your Splunk environment. The Data Inventory feature of Data Management allows data owners to add Data Definitions to the inventory. Data Definitions assign ownership, contact information and other important details to either a Splunk index or an Index:Sourcetype pair. Data definitions also includes useful metrics about the data source that is pulled from Splunk and displayed in the Data Inventory. When fully populated, the Data Inventory can be a powerful tool for managing, monitoring, and reporting all of the data flows coming into your Splunk environment.
Choosing how to manage your data with Data Definitions
You must choose how you want to manage your data in Data Management. You can assign data ownership, and other metadata, at either the Index or Index:Sourcetype level. Choose the option that best suits your needs but by choosing Index:Sourcetype you are able to manage things at a greater level of detail. You can also choose to do a hybrid approach where you assign ownership and metadata at both levels. The best methodology to choose is dependent on how you have architected your Splunk environment.
Monitoring the Progress of the Data Inventory
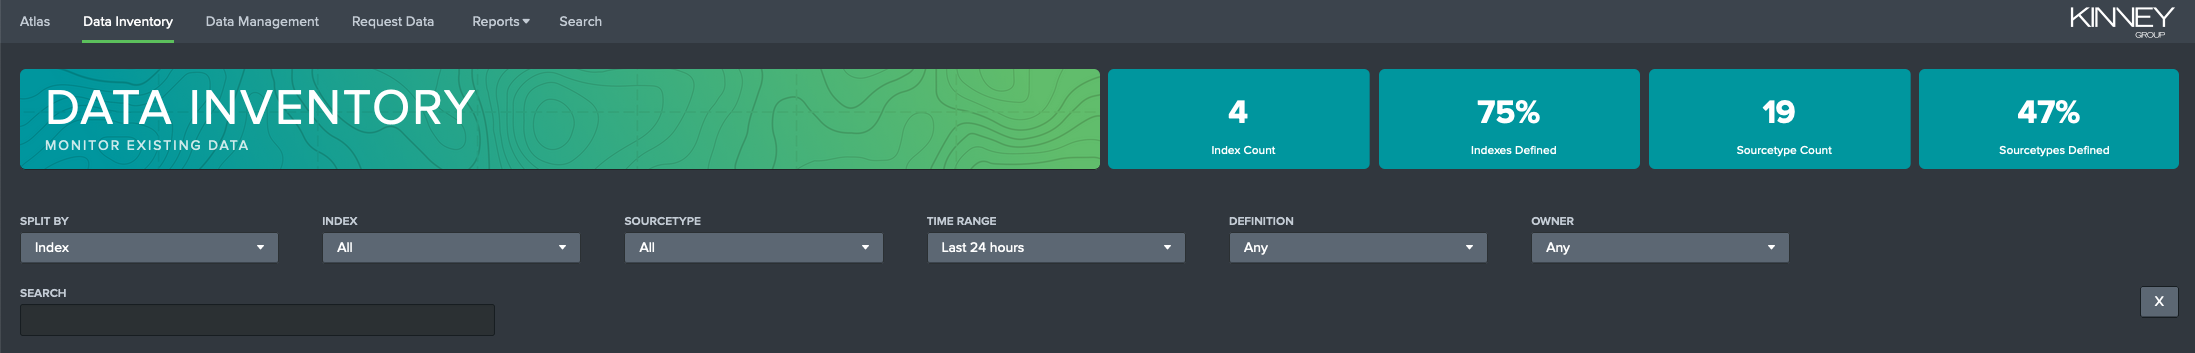
Data Management will help you track and monitor the status of your Data Inventory. The following KPIs are shown at the top of the Data Inventory Page:
- Index Count: The total number of active indexes found in your Splunk environment in the selected time range. The time range defaults to the last 24 hours.
- Indexes Defined: Tracks the percentage of indexes that have data definitions assigned.
- Source Type Count: The total number of active sourcetypes found in the selected time range. The time range defaults to the last 24 hours.
- Source Types Defined: Tracks the percentage of sourcetypes that have data definitions assigned.
Data Inventory List
Your entire data inventory is shown by default in the inventory list on the Data Inventory page in Data Management. Filters at the top of the page are used to isolate the results down to data inventory items that you want see. You can display this list by Index or Index:Sourcetype depending on how you have decided to manage your data inventory.
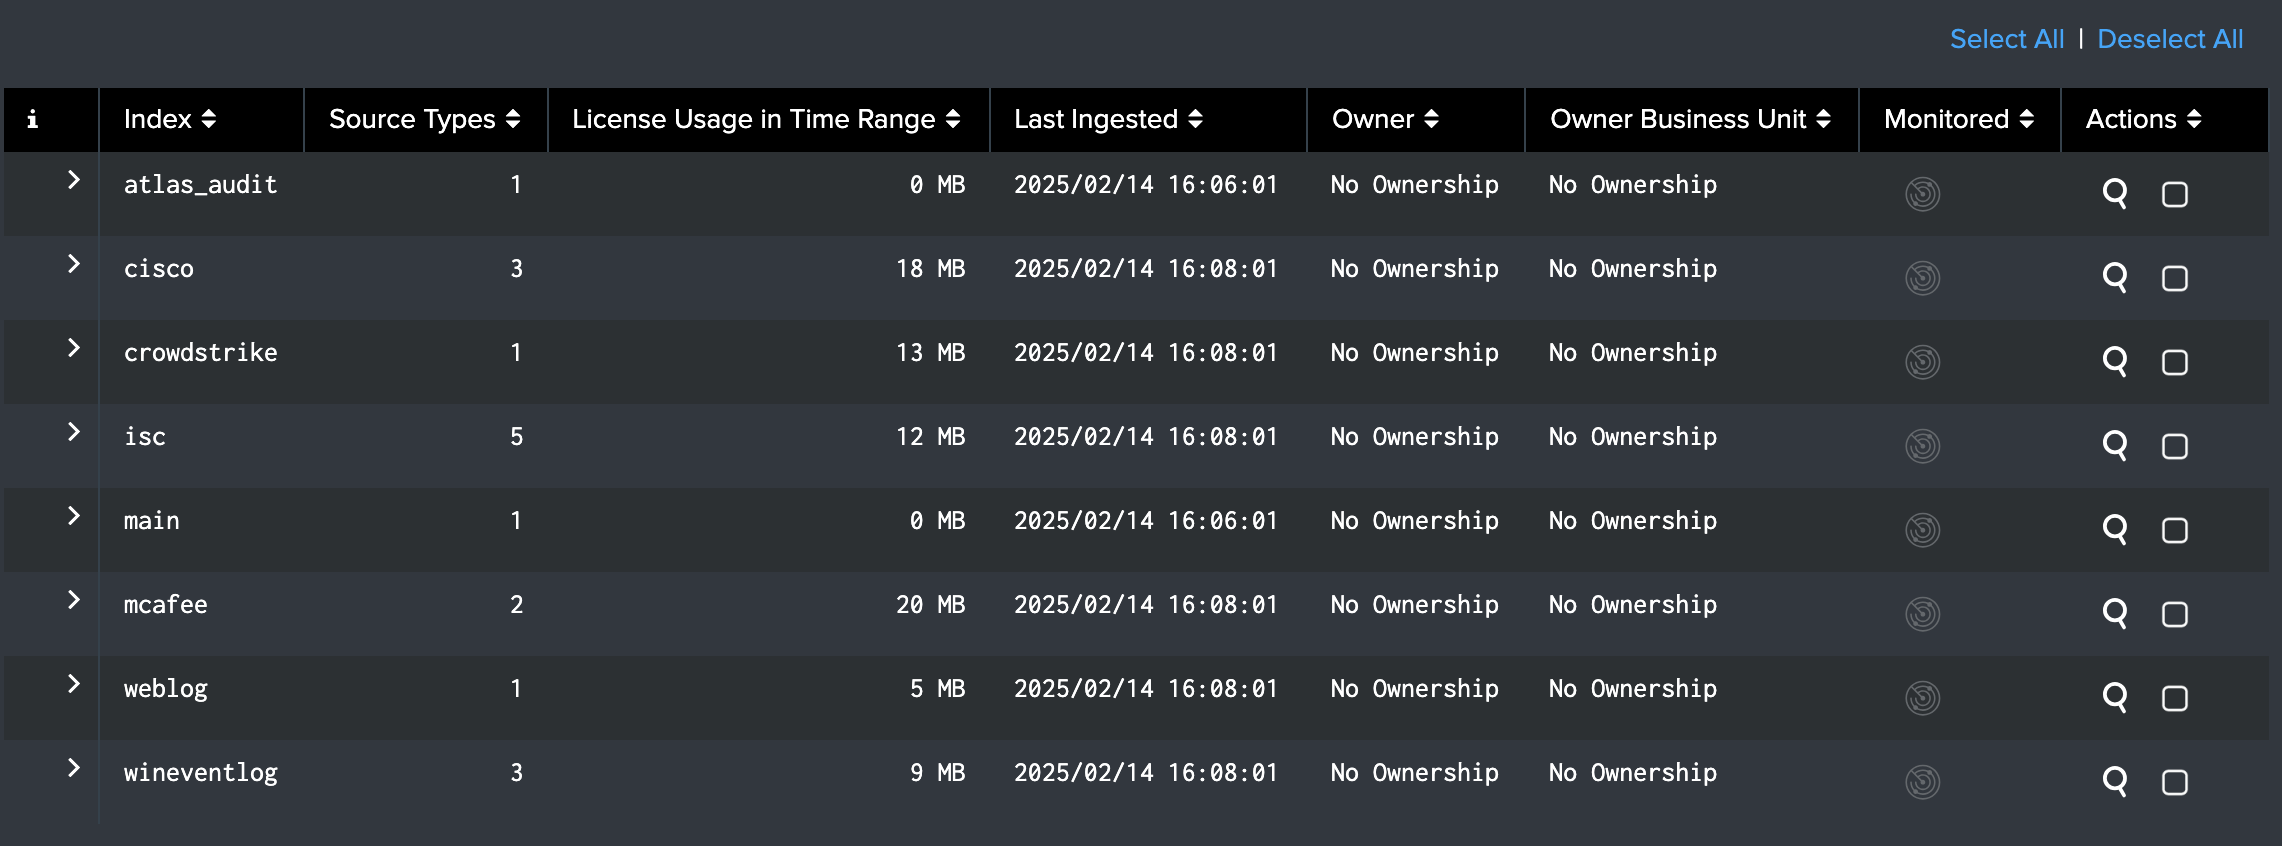
The data inventory list displays the following fields:
- Index: An active Splunk index identified by Data Management.
- Sourcetype: An active Splunk sourcetype identified by Atlas Data Management.
- License Usage in Time Range: The amount of Splunk license used by the index or index:sourcetype in the selected time range.
- Last Ingested: Time stamp of the last event ingested for the index or index:sourcetype.
- Owner: Data Owner defined in the Data Definition if populated.
- Owner Business Unit: Data Owner Business Unit defined in the Data Definition if populated.
- Monitored: Indicates if the data source is being actively monitored by Atlas Monitor. If the Atlas Monitor Icon is gray there is no active monitor configured for the data inventory item. If the Atlas Monitor Icon is white, there is an active monitor for the data inventory item.
- Actions: Contains actions that can be taken on the data inventory item. The magnifying glass opens a search in the Splunk Search and Reporting App. The checkbox enables Bulk Edit.
Users can export this table by hovering over the table and clicking the Export button in the top right corner of the table.
Viewing, Creating, or Editing a Data Definition
Clicking the arrow (>) to the left of any data inventory item reveals the Data Definition. You can create the data definition by clicking the Add Definition button and complete the 'New Data Definition' fields. If a data definition has already been created, you can edit it by clicking the Edit Definition button. You can also Bulk Edit multiple datasets by selecting their checkboxes in their Actions column and selecting the Bulk Edit button that appears on the bottom right of the table.
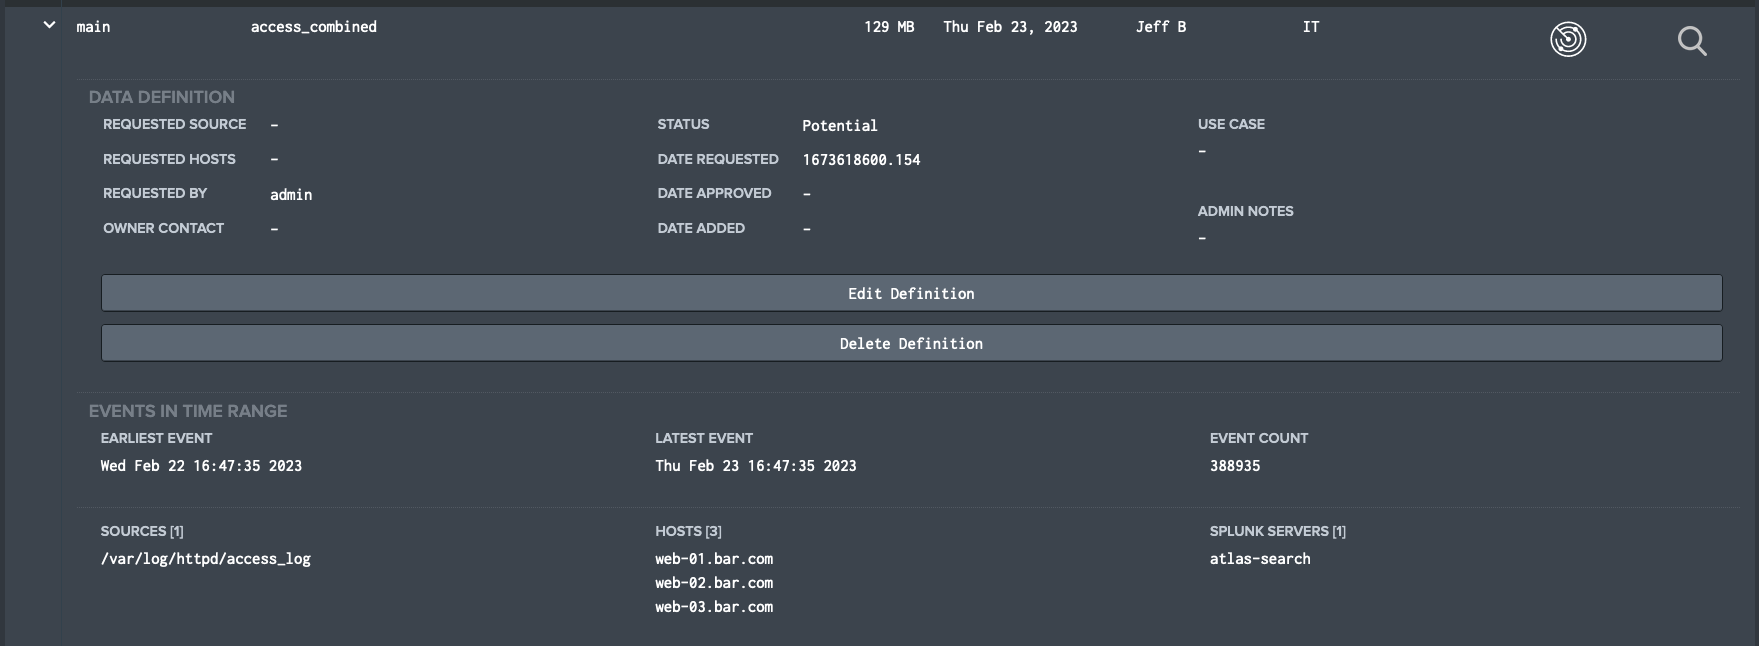
Data Definition Fields
- Requested Source: Source information provided in the Data Request, if populated.
- Requested Hosts: Hosts information provided in the Data Request, if populated.
- Requested By: Requested By information provided in the Data Request, if populated.
- Owner Contact: Owner Contact information such as email address or phone number.
- Status: Status of the data type. Provided values are (Static, Live, Deprecated, Potential, Anticipated, Removed)
- Date Requested: Date the data source was requested, if provided
- Date Approved: Date the data request was approved, if provided.
- Date Added: Date that the data source was added, if provided.
- Use Case: The business use case that the data inventory item supports.
- Admin Notes: Notes provided by the Splunk administrator.
Bulk Edit: Bulk edit enables editing a certain selection of fields. When bulk editing, any changes inputted into a field will overwrite all previous entries in the selected datasets. Leaving a field empty will not change any previous entries in said field.
Events in Time Range
The Events in Time Range section shows event information pulled from Splunk about the index or index:sourcetype.
- Earliest Event: The first indexed event found for the data inventory item in the selected time range.
- Latest Event: The latest indexed event found for the data inventory item in the selected time range.
- Event Count: The number of indexed events found for the data inventory item in the selected time range.
- Sources: The data sources found for the data inventory item in the selected time range.
- Hosts: The hosts found for the data inventory item in the selected time range.
- Splunk Servers: The splunk servers found for the data inventory item in the selected time range.
Index Information
The Index Information section provides information pulled from Splunk about the Splunk index for the selected data inventory item.
- APP: The app in which the index resides.
- Data Type: Type of index.
- Retention Period: Data retention period for the index.
- Replication Factor: Index replication factor.
- Maximum Size: Maximum size of the index.
- Earliest Event: Date and time of earliest event in the index.
- Latest Event: Date and time of the most recent event in the index.
- Total Event Count: Total events in the index.
- Current Size: Current size of the index.
- Home Path: The home path of the index.
- Cold Path: The cold bucket path of the index.
- Thawed Path: The path that contains the thawed databases for the index.
Sourcetype Information (if selected)
If a Sourcetype is selected, a Sourcetype Information section appears with event parsing information from props and transforms files.
- SHOULD_LINEMERGE: [TRUE|FALSE] This setting controls whether or not Splunk should combine several lines of data into a single event.
- LINE_BREAKER: This attribute specifies a regex that determines how the raw text stream is broken into initial events.
- TRUNCATE: A max value for how many bytes an event can be.
- TIME_PREFIX: Defines the text that prefixes an event’s timestamp.
- MAX_TIMESTAMP_LOOKAHEAD: Defines for Splunk, how far into the data to search for a timestamp.
- TIME_FORMAT: The format of the timestamp.
- TZ: The timezone specified for the sourcetype.
- SOURCE TYPES RENAMED FROM: The human readable alias for a sourcetype if provided.
- SOURCE MATCHES: If a source (origin of Splunk data) matches the pattern supplied, then data is assigned to this sourcetype.
- CATEGORY: Defines the type of logs the sourcetype belongs to.
- DESCRIPTION: Sourcetype description.
Monitored (Data Watches)
Monitoring the health of your data source is an important aspect of Atlas. Atlas Data Management works with the Atlas Monitor Element to ensure that you know the health of your data feed by setting up what we call Data Watches. The Monitored column of the Data Inventory list indicates if the data is actively being monitored by Atlas Monitor or not. If the icon is gray there is not a data monitor in place for this. If the icon is white there is a data monitor configured in Atlas Monitor. You can use Atlas Monitor to watch your data feeds into Splunk and alert on them if they fall below configured thresholds.
Actions
Clicking the 'magnifying glass' icon to the right of any data inventory Element launches a Splunk search that is filtered to return just the events from that data source index and sourcetype to allow you to inspect the data more closely.
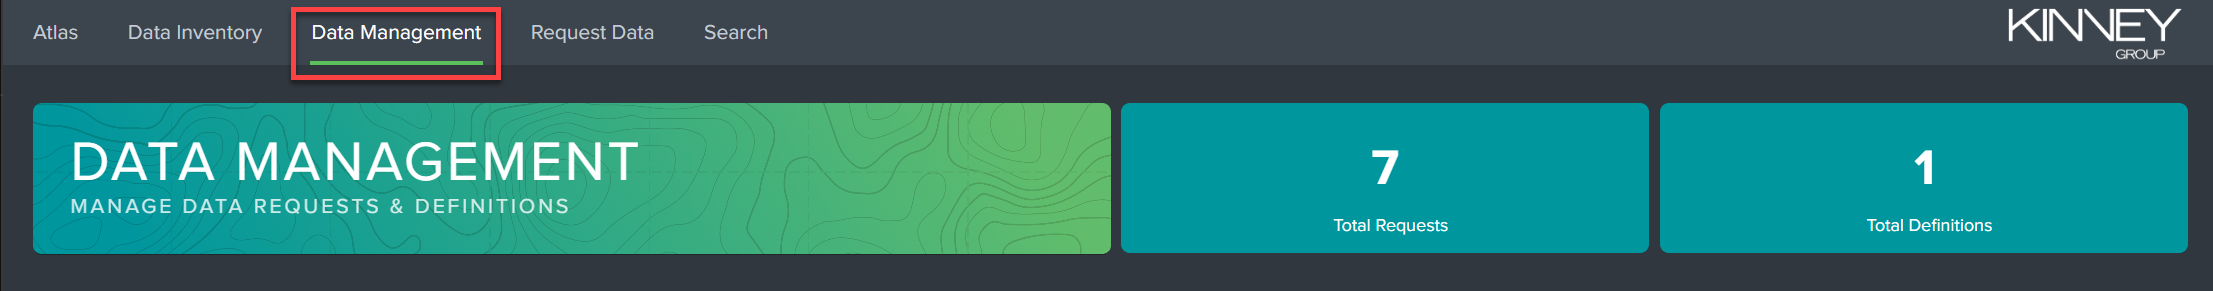
Data Management Dashboard
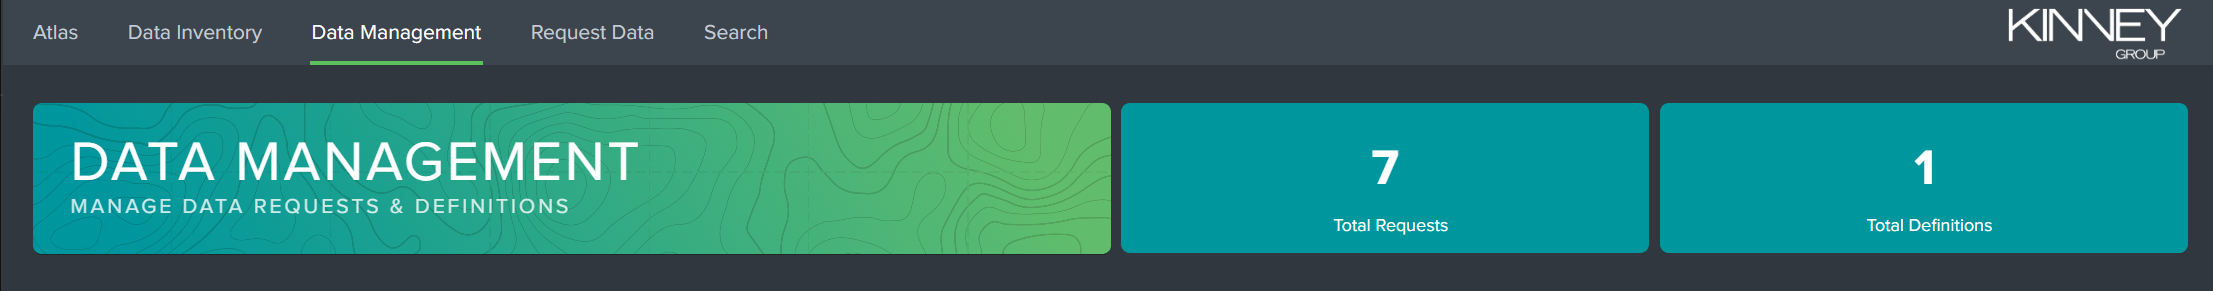
The Data Management dashboard is the place where Splunk Administrators will monitor the lifecycle of Data Requests and Data Definitions. On the Data Management dashboard a Splunk Admin can see all of the pending, current, and past data requests. A Data Request is created by a user who submits a request to onboard data into Splunk on the Data Requests page. Once a Splunk Admin, or someone responsible for reviewing a Data Request, has completed the process of onboarding the data in Splunk, the Data Request should be converted to a Data Definition. The KPI boxes at the top of the Data Management page provides an overview of the outstanding Data Requests and completed Data Definitions.
Data Definitions can originate from both the Data Inventory page or from the Data Management page. The total definitions listed on this page shows all Data Definitions that have been created.

Below the top banner, Data Management allows the user to filter data presented in both the Data Requests and Data Definitions dashboards which follow on a number of fields: Status, Owner, Owner Business Unit, App Content, and Last Updated. There is also a ad-hoc Search filter, and clicking the X button to the right sets all filters to default values.
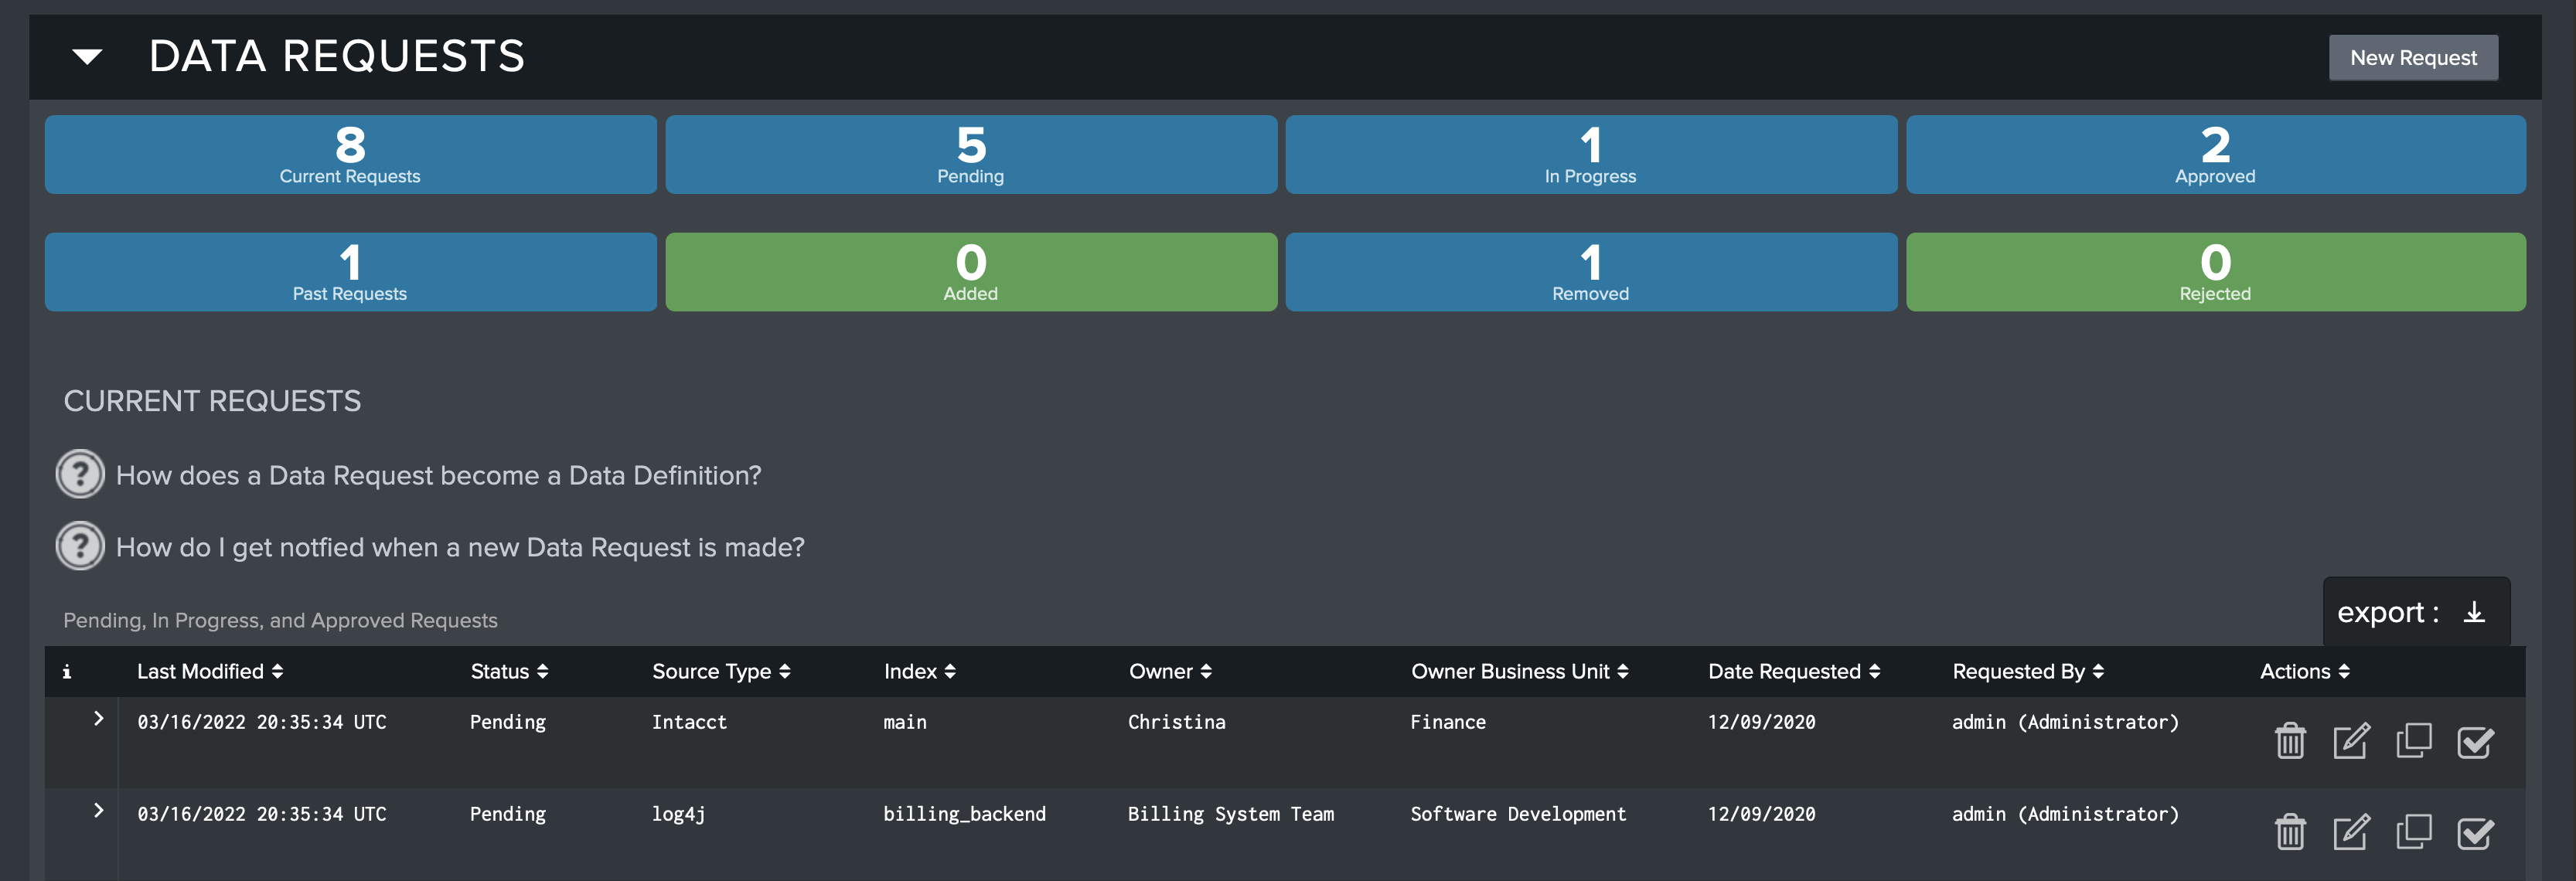
Data Requests
The Data Requests section is the list of active requests currently in the system. The Current Requests table shows all active Data Requests. A new Data Request can be initiated from this view using the New Request button. The Past Requests table shows all requests that have been processed.
Request Statuses
Current Requests are Data Requests that have the following statuses and are waiting to be processed:
- Pending: The request is pending review or approval by someone who can start the data onboarding process.
- Approved: The request has been approved and is waiting to move to In Progress.
- In Progress: The data is currently being Added to the Splunk environment.
Past Requests are Data Requests that have the following statuses and are considered already processed:
- Added: The data has been added to Splunk.
- Removed: The data has been removed from Splunk.
- Rejected: The request to add the data to Splunk has been rejected.
Request Actions
Each Data Request has the following Actions that can be executed:
- Delete Request:(Trash Can Icon) Delete the Data Request from the list.
- Edit Request:(Pen & Paper Icon) Change attributes of the request.
- Clone the Request:(Copy Icon) Clone the request to a new Data Request.
- Create Definition:(Checkbox Icon) Convert the request into a Data Definition indicating that the request has been completed.
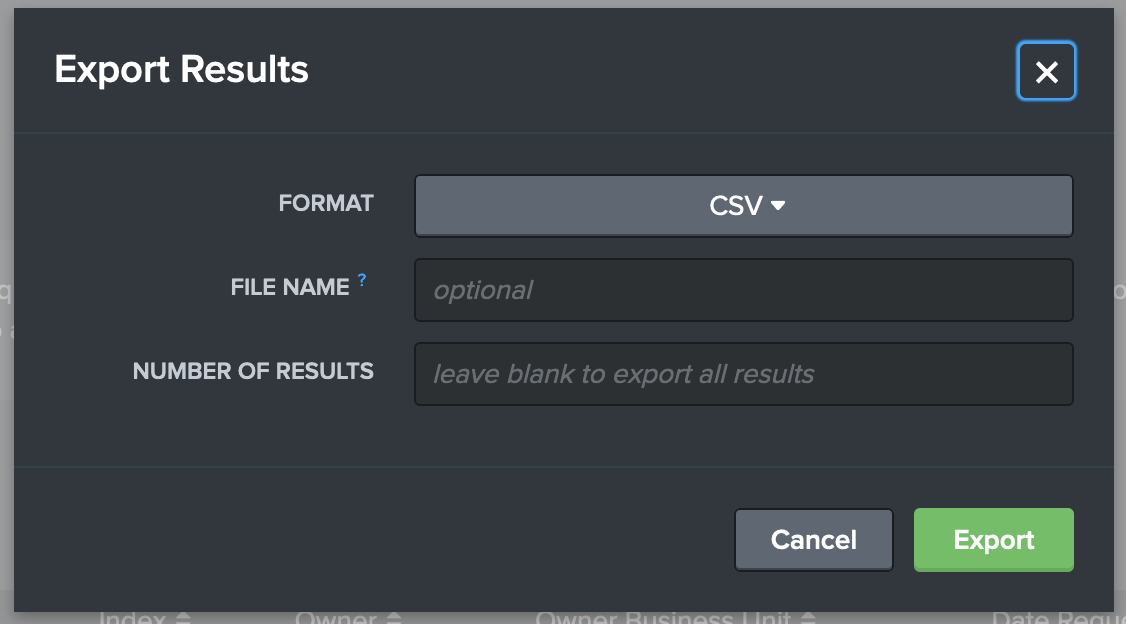
Results displayed in the dashboard can be exported in .CSV, .XML, or .JSON format by clicking the Export button on the right-hand side. Note that any filters applied will result in only the displayed results being exported.
Data Definitions
The Data Definitions dashboard shows similar information to the Requests Dashboard, but for Data Definitions. This is for creating Data Definitions that were not added through a Data Request workflow. New Data Definitions can be created by clicking the New Definition button located in the top-right of the section.
The Data Requests are listed under two status categories, Active and Inactive.
Active Data Requests have the following statuses:
- Live: The Data Definition is currently live in Splunk.
- Static: Indicates that the data source configuration should not be changed or manipulated
- Deprecated: The data is being scheduled for removal but is still live.
Inactive Data Requests have the following statuses:
- Potential: Indicates that the Data Request is being considered for onboarding to Splunk.
- Anticipated: Indicates that the Data Request has been approved and will be onboarded into Splunk.
- Removed: Indicates that the data has been removed from Splunk and is no longer active.
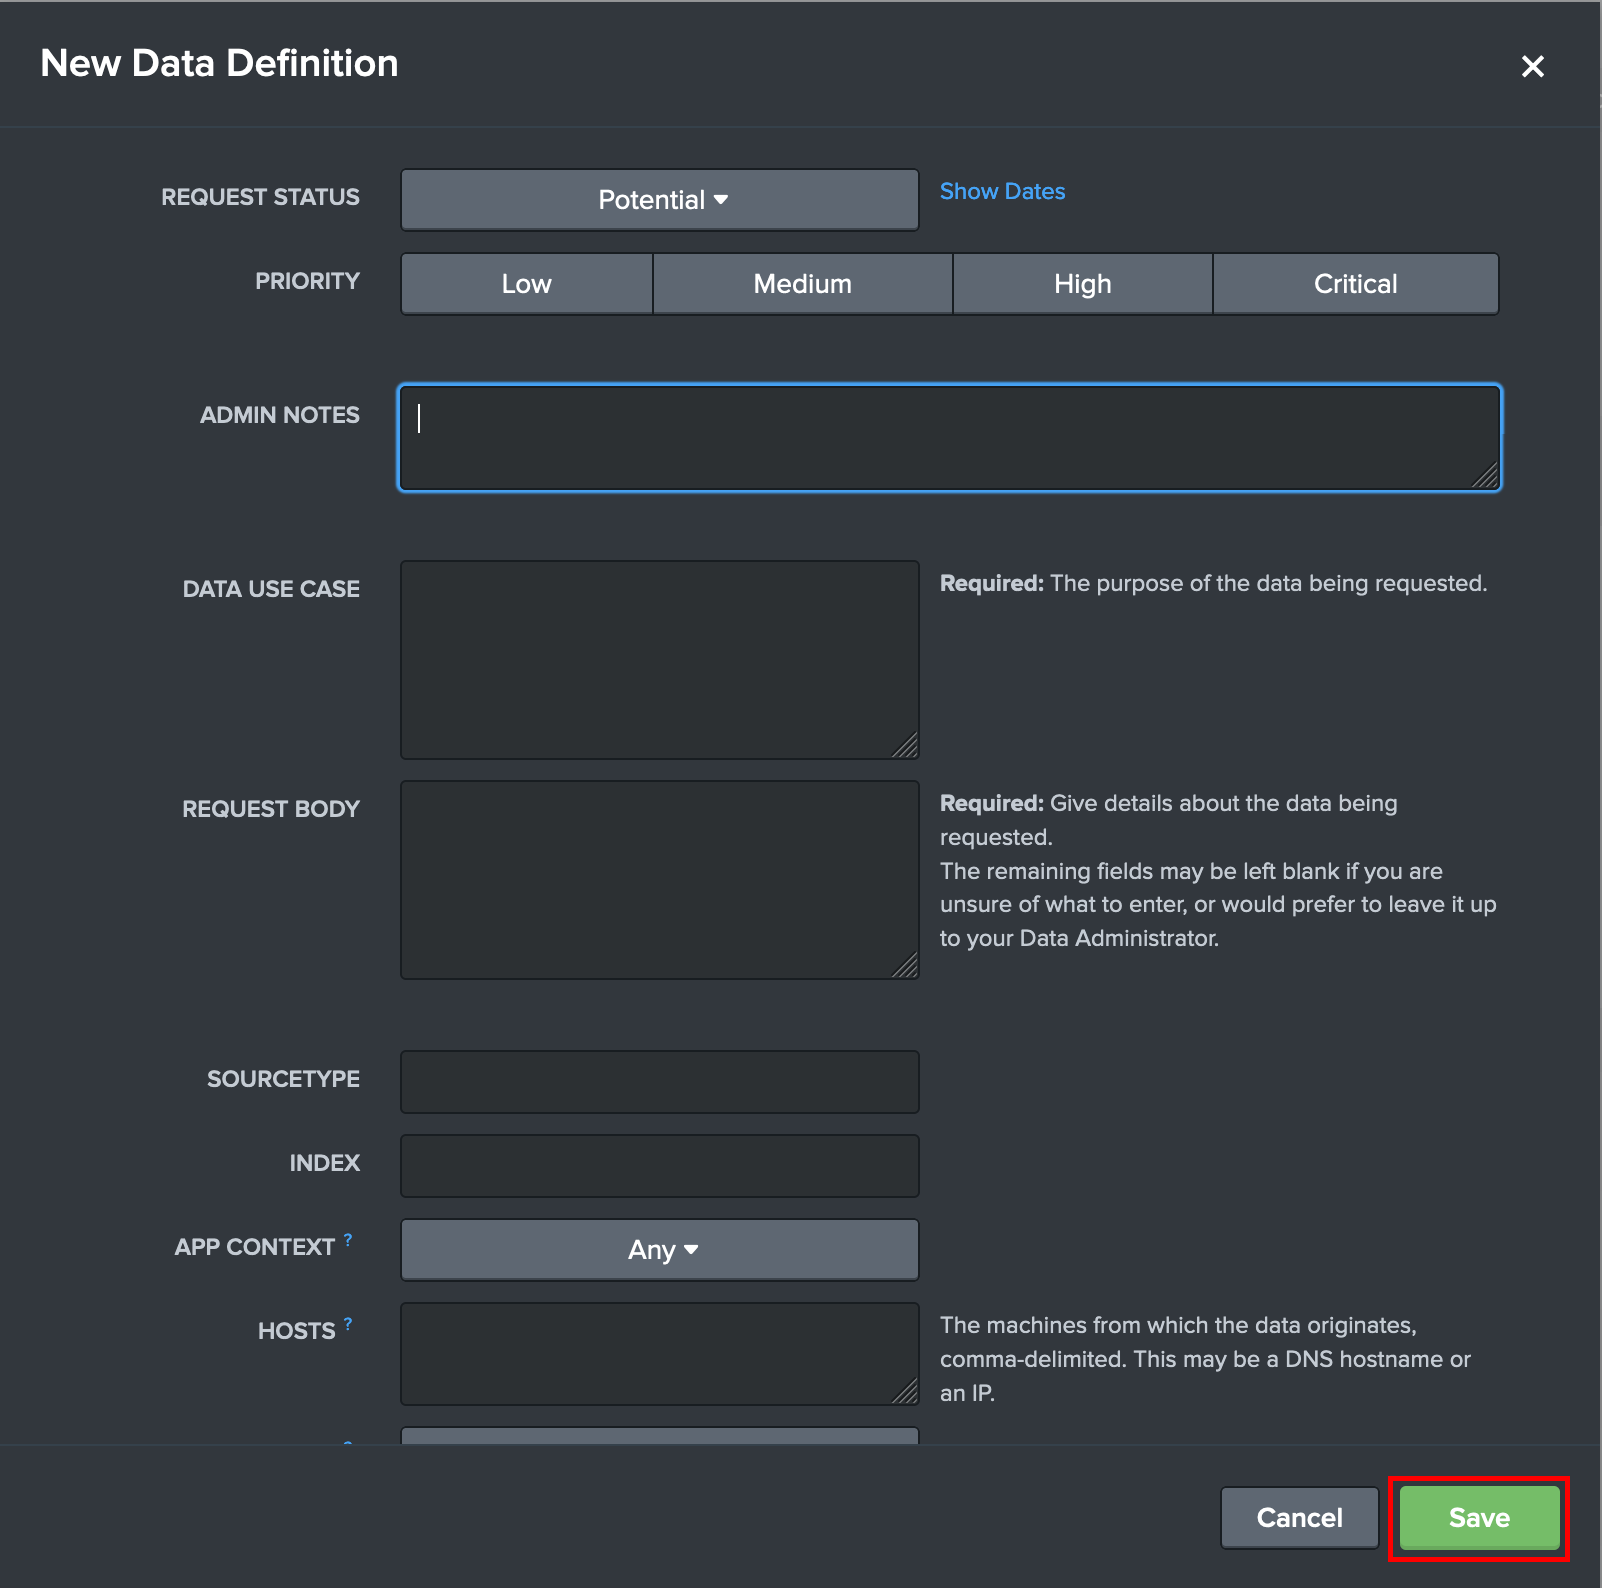
Create a New Data Definition
- Navigate to the Data Management dashboard.
- Locate the Data Definitions section of the page and click the New Definition button.
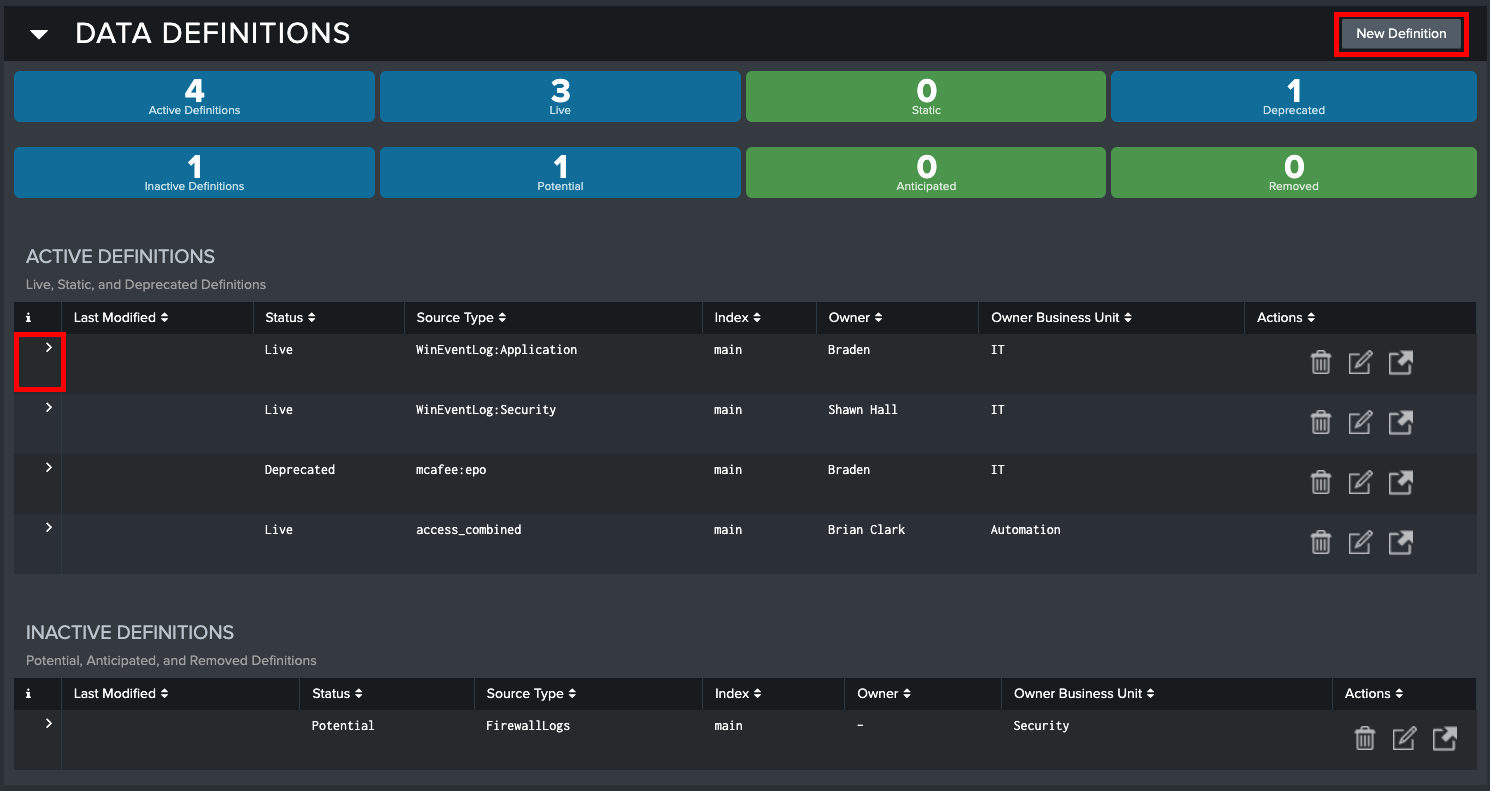
- A modal labeled 'New Data Definition' will appear. Use the dropdown menus to select the values for the Data Definition. If you are unsure about what a field should contain, there is help text available by hovering over the blue question mark next to a field. Click the green Save button in the bottom-right corner to save the definition.
- The status of the new definition automatically populates as 'Potential' in the 'Inactive Definitions' list. Clicking the arrow (
>) on the left of the definition reveals the expanded metadata.
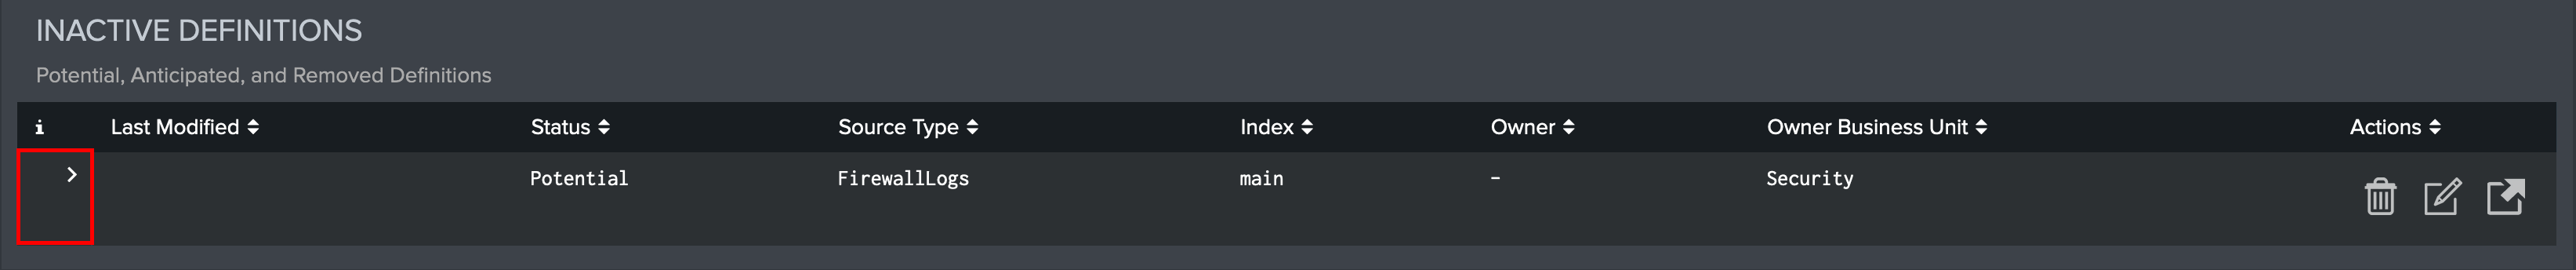
- The Splunk Administrator or person who is monitoring the Data Requests is notified and can update the status of the request as it progresses through the data onboarding lifecycle.
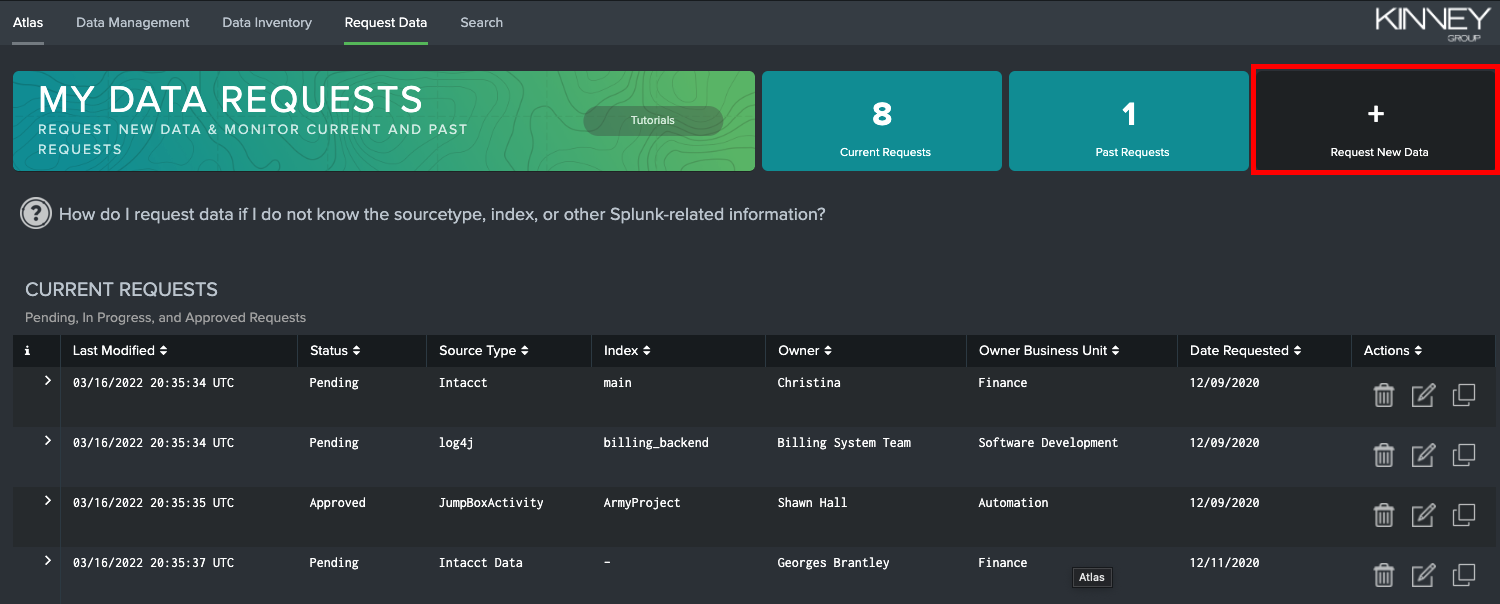
Request Data Dashboard
The Request Data dashboard is where Splunk users will create new Data Requests and view existing. The KPIs at the top of the page show the number of current (active) and past (completed) requests. To create a new Data Request the Request New Data button can be found at the top of this page. Data requests on this page use the Status field to determine if they are open or closed. Active requests will have a Pending, In Progress, or Approved status. Closed Data Requests will have an Added, Removed, or Rejected status. See the status descriptions for more detailed information.
Next to each request are buttons to delete, edit, or clone the request. See the Request Actions for more detailed information. To view the metadata of the request which includes all of the details about the request, click the arrow (>) on the far left of any request.
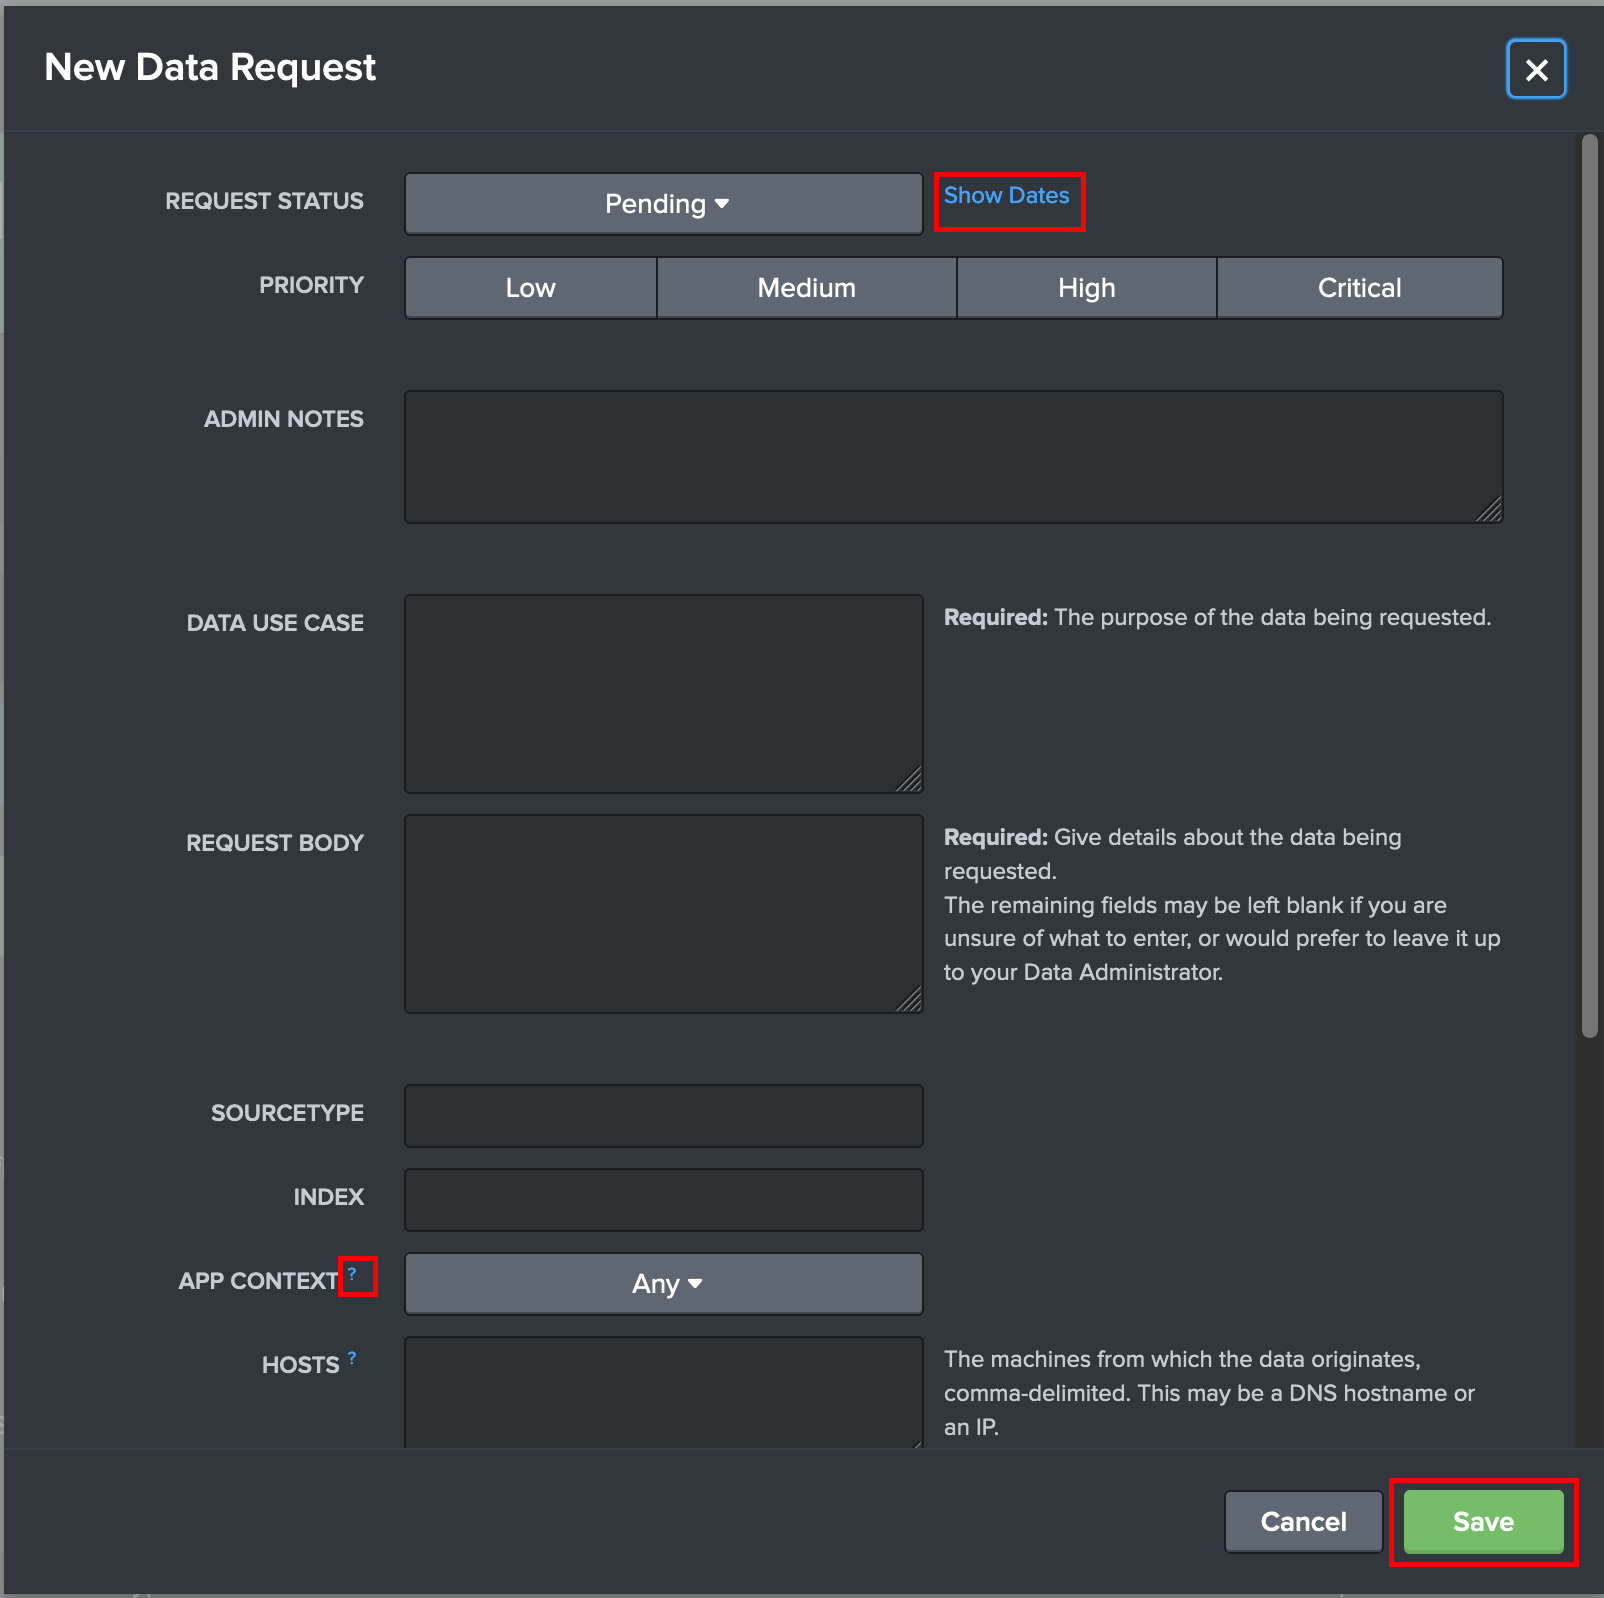
When a new Data Request is started by clicking on the Request New Data button in the top-right corner of the page, a modal appears that provides all of the fields needed for the Data Request. Information about each field, including whether it is required or not, is available by hovering over the question mark icon found to the right of each field.
Creating a New Data Request
- Navigate to the Request Data dashboard
Click the
+symbol labeled 'Request New Data' in the top-right corner of the tab. This opens the New Data Request window.The window that appears will prompt users to use dropdown menus to select a status, an app context, and a data ingest method for the request. Users can type to fill in the remaining fields.
Clicking 'Show Dates' next to the Status menu reveals fields that describe when the request was created, resolved, added, and removed using a calendar menu.
If you are unsure about what a field should contain, there is help text available by hovering over the blue question mark next to a field.
Edit or Delete a Data Request
Reports
The Reports dashboard provides a set of reports that leverage information from the Data Definitions provided in the Data Inventory.
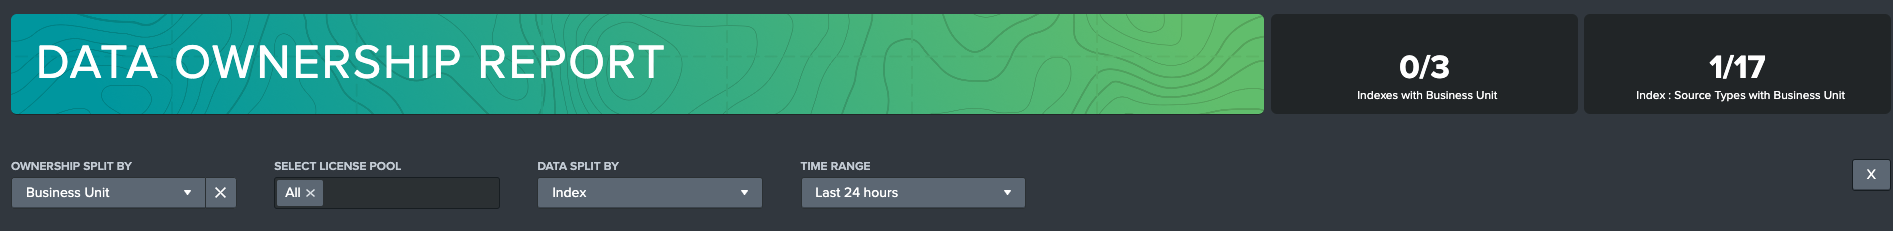
Data Ownership Report
The Data Ownership report utilizes the Owner and Business Unit fields assigned in your Data Definitions to provide visibility into data ownership and reports on data ingest rates by data ownership.
On the filters, you can select if you want to use the owner or business unit fields as the key for the report. The Select License Pool filter enables you to include or exclude license pools from your ownership report. This is useful when you have license pools you want to exclude from your overall reporting. You can set the report to view data ownership by Index, or by Index and Source Type. The time range field determines what time period is considered when populating the report. By default the time range is set to the Last 24 hours.
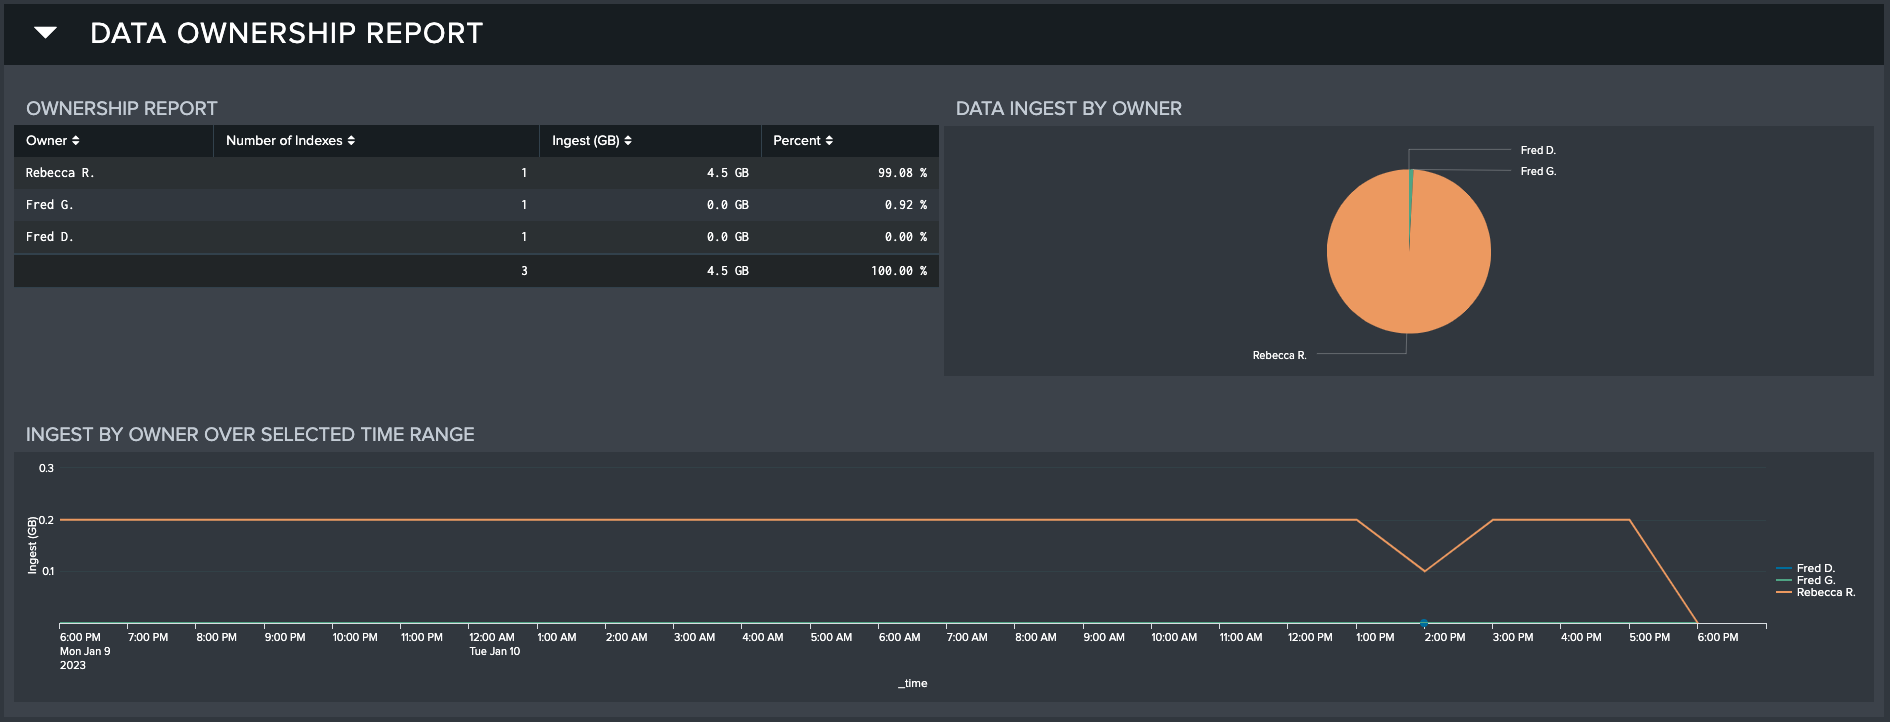
The Data Ownership report contains 3 main visualizations. The first, the Ownership Report, contains a list of all owners or business units (depending on the filter selected) and how much data ingest was discovered in the selected time range that is under their ownership. This table includes a 'No Ownership' value for any data that does not have an owner populated in the Data Definition. This data can be visualized in the Data Ingest by Ownership pie chart to the right of the Ownership Report.
Lastly, the Ingest by Ownership Over Selected Time Range time chart is at the bottom of the report. This visualization displays the makeup of the data ingest by ownership over the time range. This can be useful for identifying usage spikes or ingest changes over a time period.
Importing Data Definitions from External Sources
Atlas allows users to import existing Data Definitions information for use with Atlas Data Management. The following section will guide you through this process, and assumes that you have a collection of information about your existing data inputs which can be arranged into CSV format.
Step 1: CSV Creation
Create a CSV from your data inputs information with the following fields, using the first row as a header with the field names:
| Field Name | Description of Field |
|---|---|
| status | One of: In Progress / Approved / Rejected / Added / Removed. |
| updated | When the status was last changed. If you don’t have a value for this field, use the current date in mm/dd/yy format. |
| date_created | When the data was requested. If you don’t have a value for this field, use the current date in mm/dd/yy format. |
| date_resolved | The date when the requested data was approved. If you don’t have a value for this field, use the current date in mm/dd/yy format. |
| date_added | The date when the requested data was added. If you don’t have a value for this field, use the current date in mm/dd/yy format. |
| date_removed | The date when the requested data was removed. Leave blank if not applicable. |
| owner | Person or group responsible for the data input. |
| owner_business_unit | The business unit of the data input’s owner. |
| index | Index for the data input. |
| sourcetype | Source Type for the data input. |
| description | Description for the data input. |
| admin_notes | Notes from the admin about adding the data for the owner. |
| created_by | Who requested the data. |
| data_ingest | Method of data ingest: See Data Management request data form for options. |
| data_app | The app where the input and any props or transforms will be stored. |
| data_source | The file path or other source value for the data input. |
| data_hosts | The source hosts for the data input. |
| request_notes | Notes from the data requester for the admin. |
Step 2: CSV Upload
- Navigate to 'Settings' in the Splunk Web GUI.
- Click Lookups.
- Click 'Add new' next to the 'Lookup table files' link.
- Upload your file and name it.
Step 3: Import to atlas_data_definitions
- Navigate to Splunk Search in the Atlas Data Management App by clicking Search on the nav bar.
- Run the following query to import your csv content to the atlas_data_definitions lookup.
| inputlookup <filename>
| eval date_added=strptime(date_added,"%m/%d/%y"),
  date_created=strptime(date_created,"%m/%d/%y"),
  date_removed=strptime(date_removed,"%m/%d/%y"),
  date_resolved=strptime(date_resolved,"%m/%d/%y"),
  updated=strptime(updated,"%m/%d/%y"),
|outputlookup append=true key field= key atlas_data_definitions
You should now see the data definitions under Active Definitions on the Data Definitions tab of Atlas Data Management.