Using App Awareness
When you open the Atlas App Awareness Element from Atlas Core you land on the App Utilization page which provides an overview of Splunk app usage by app and the number of users working with each app. The App Tracking dashboard identifies the versions of the Splunk apps installed across your Splunk deployment, any version discrepancies, and detailed information about the knowledge objects for each app.
App Utilization Dashboard
It is important for administrators to know what Splunk apps are deployed in their environment and to have a clear picture of if and how their users are using those Apps. The App Utilization portion of App Awareness tracks which users are using your Splunk apps and where they are spending their time.
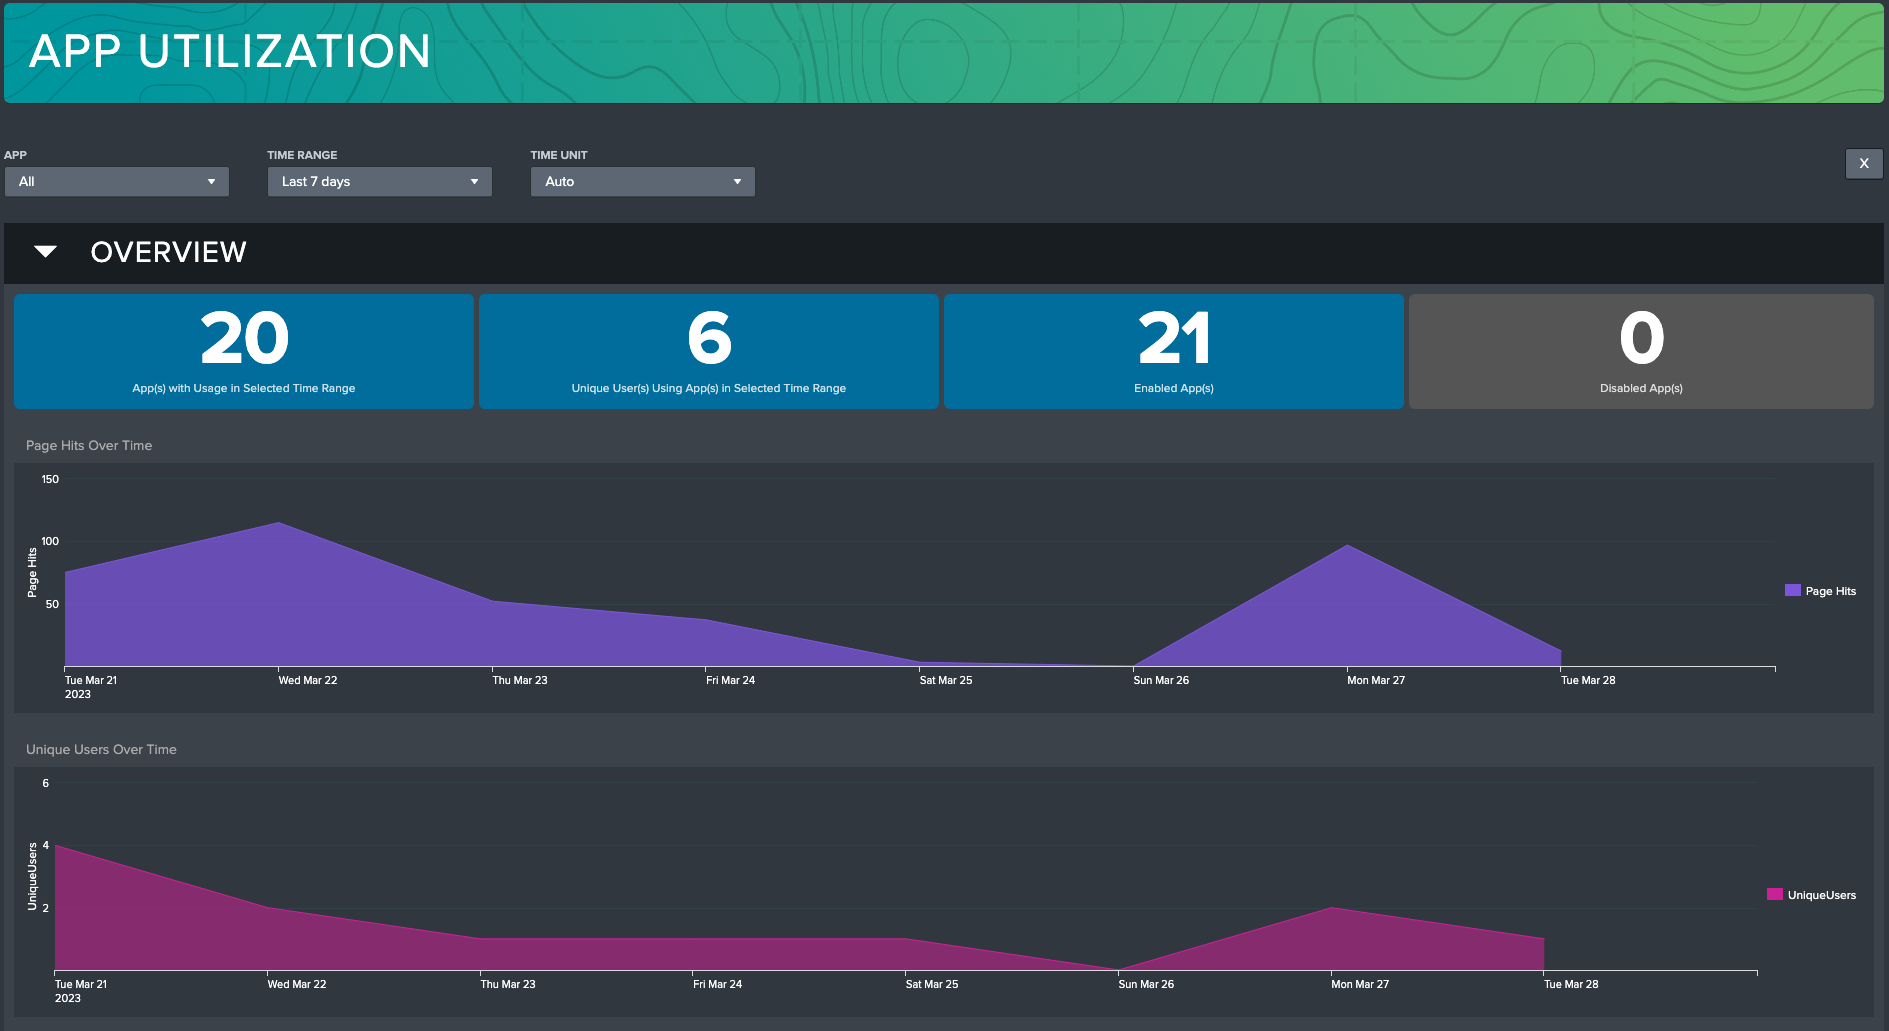
Overview
The Overview section of the dashboard is for identifying your active user counts and most popular applications. At the top of this section are four KPIs displaying the number of Splunk apps and users with identified usage in the time range, and the total count of enabled and disabled Splunk applications. Below these are charts showing Page Hits and Unique Users over the last week (or selected time period).
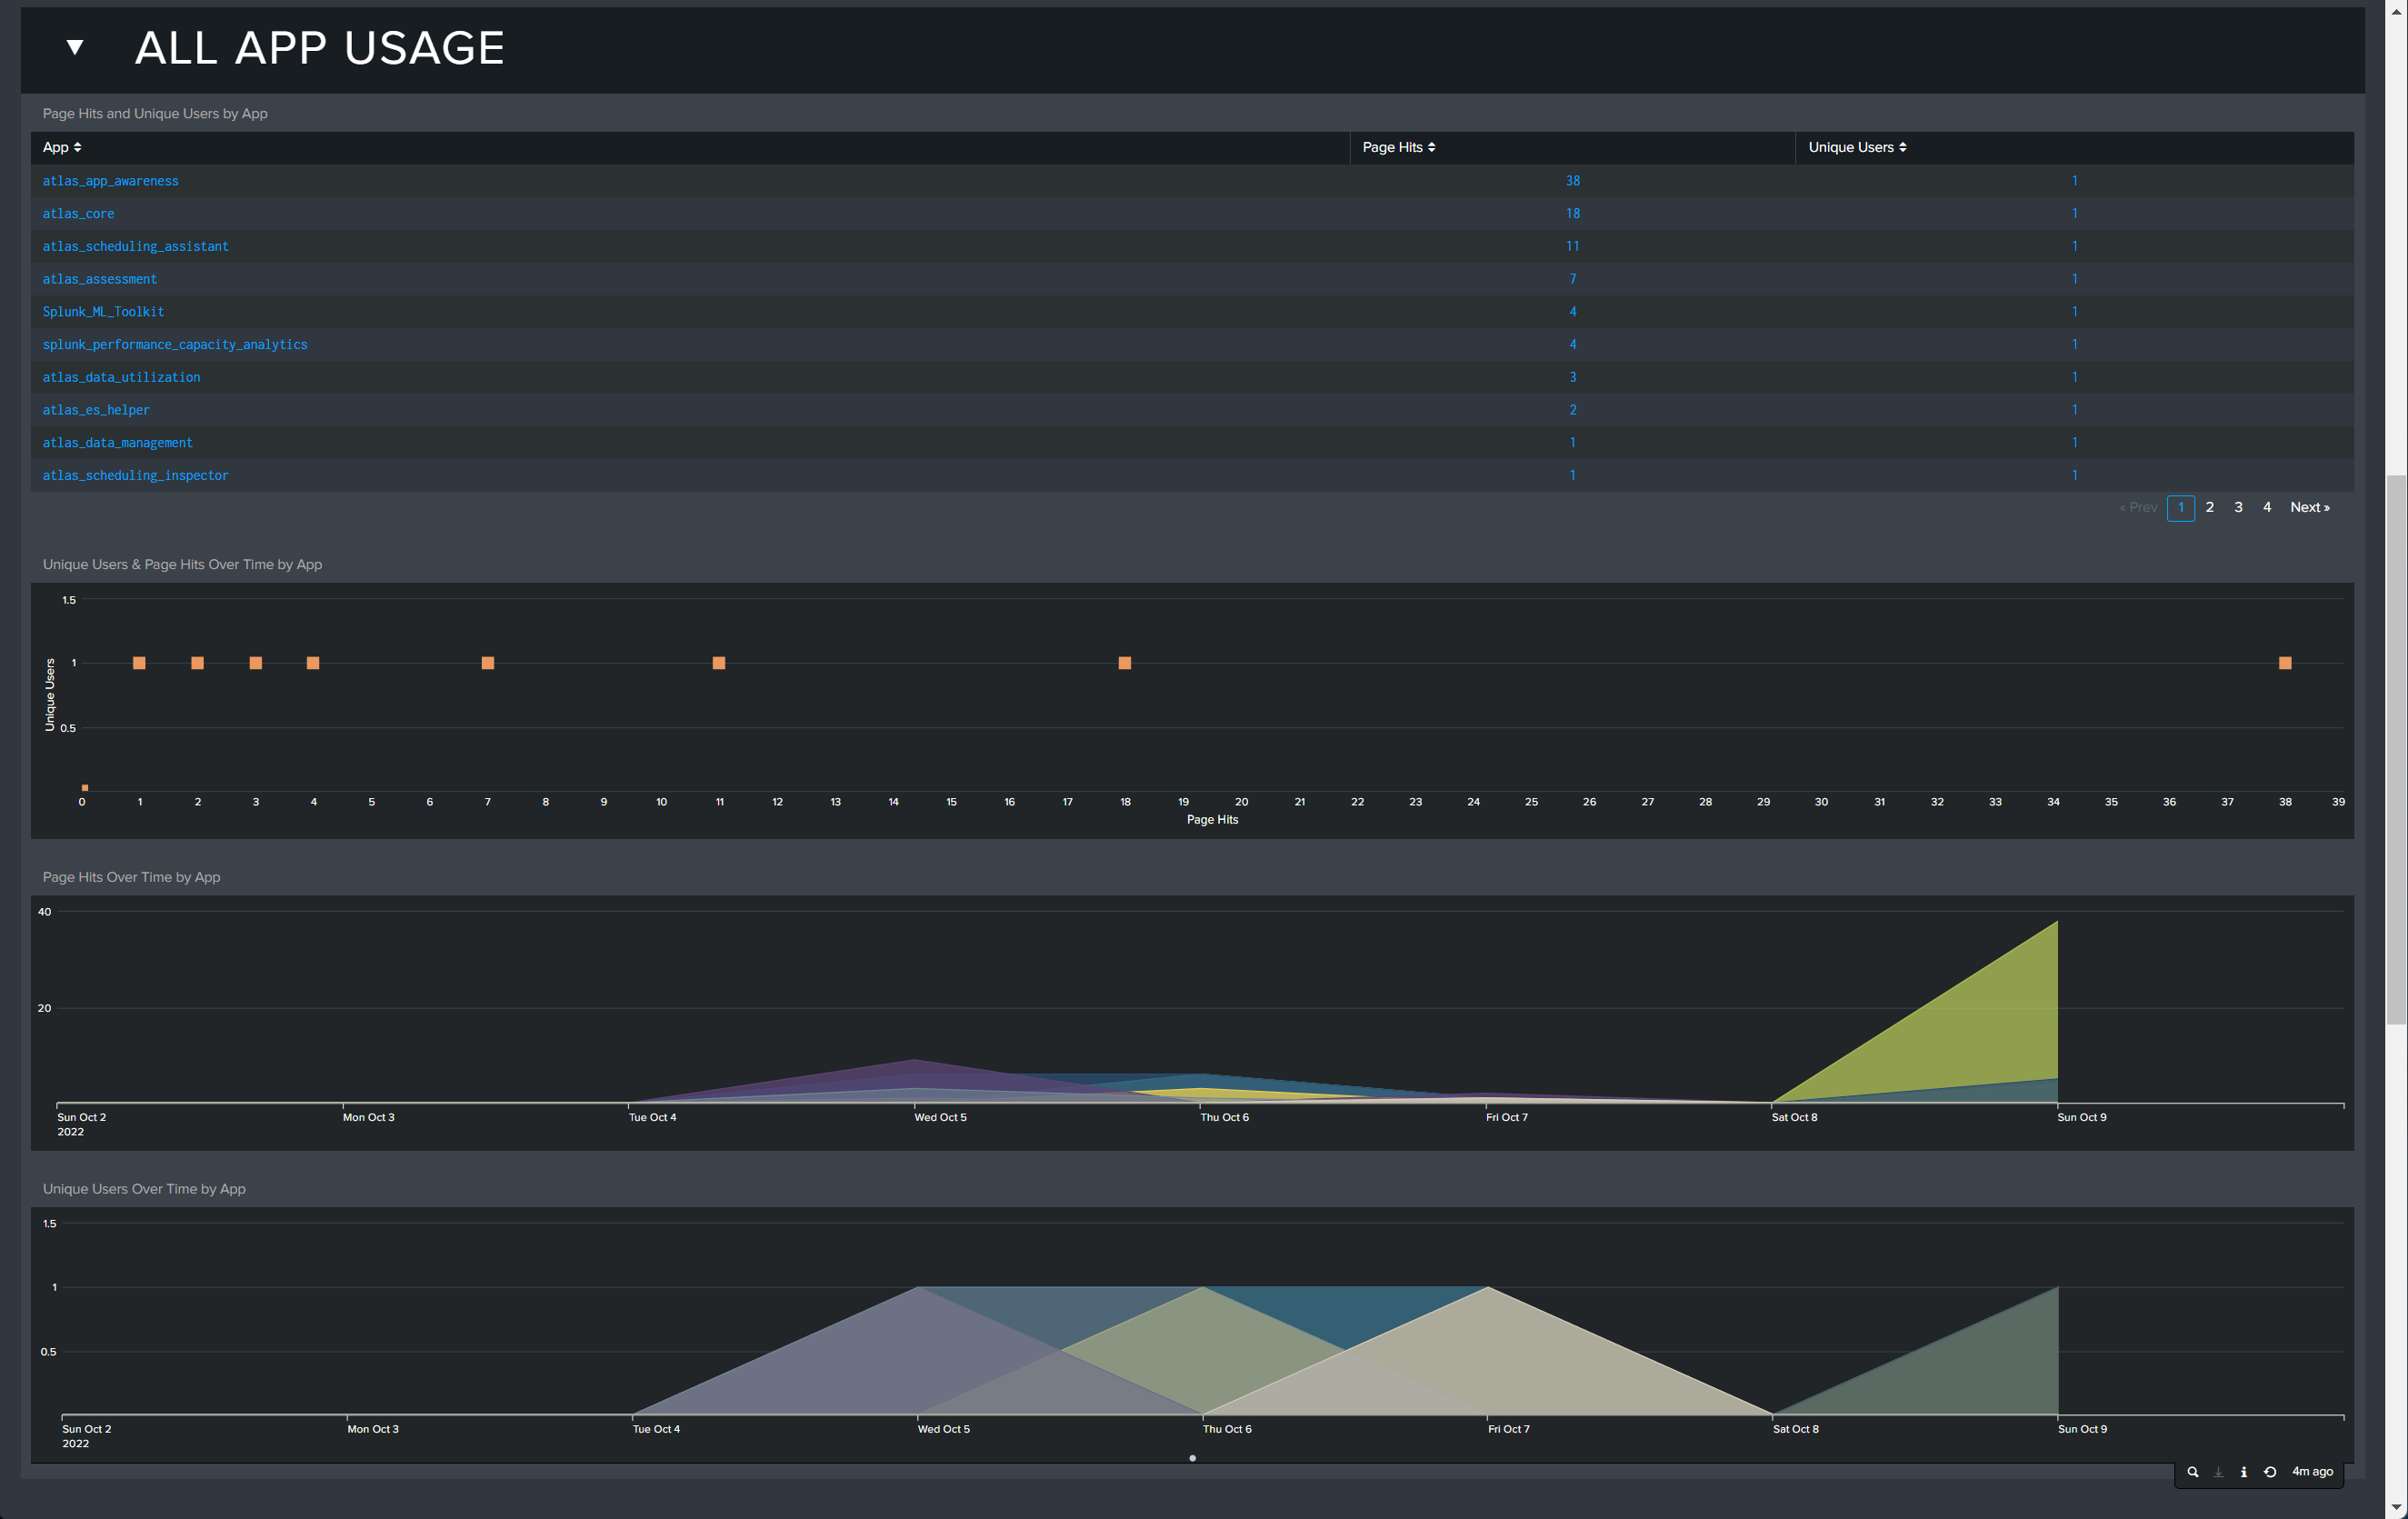
All App Usage
The All App Usage section of this dashboard provides a list of all installed apps, including the number of page hits and Unique users, per app. This section is followed by graphs that visually display the Unique Users & Page Hits Over Time by App, Page Hits Over Time by App, and Unique Users Over Time by App.
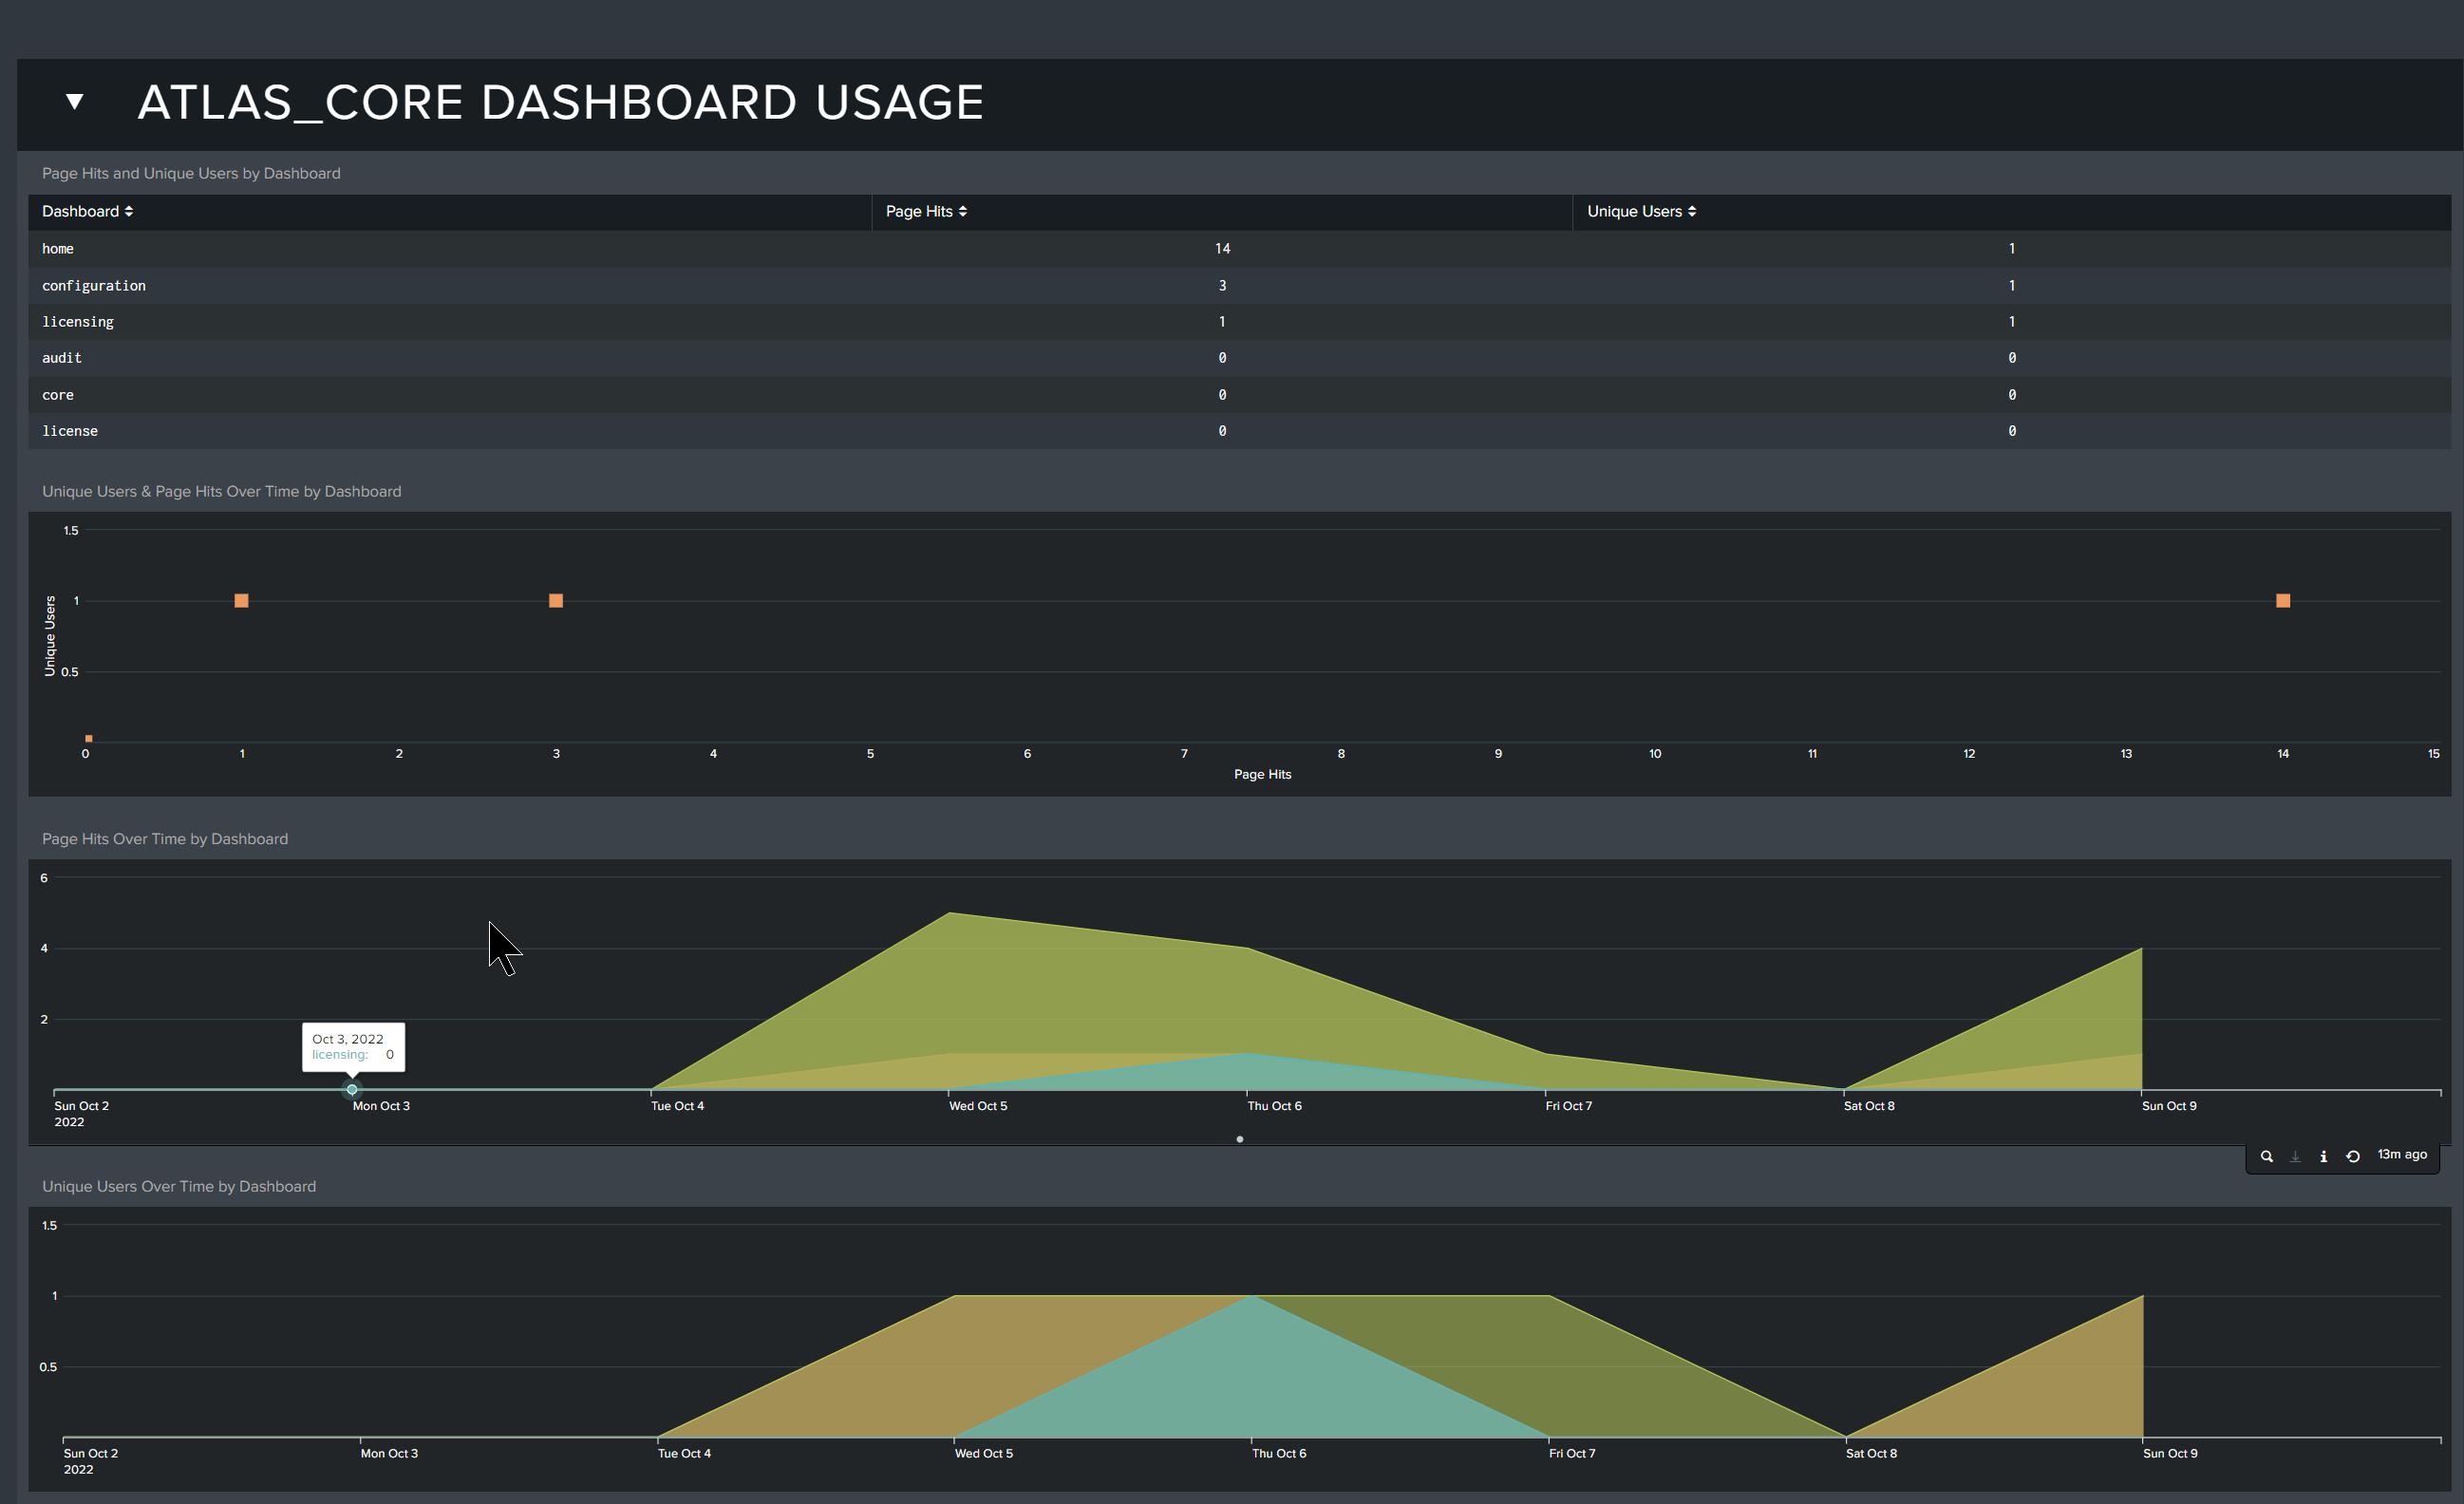
Selecting an app in the filter or in the All App Usage section re-orients the panels to inspect the utilization of the dashboards contained within the selected application. This can help to identify underused or popular dashboards and can be an indicator of where your users are spending their time when using Splunk. To leave this view, select "All" in the App Filter at the top of the page.
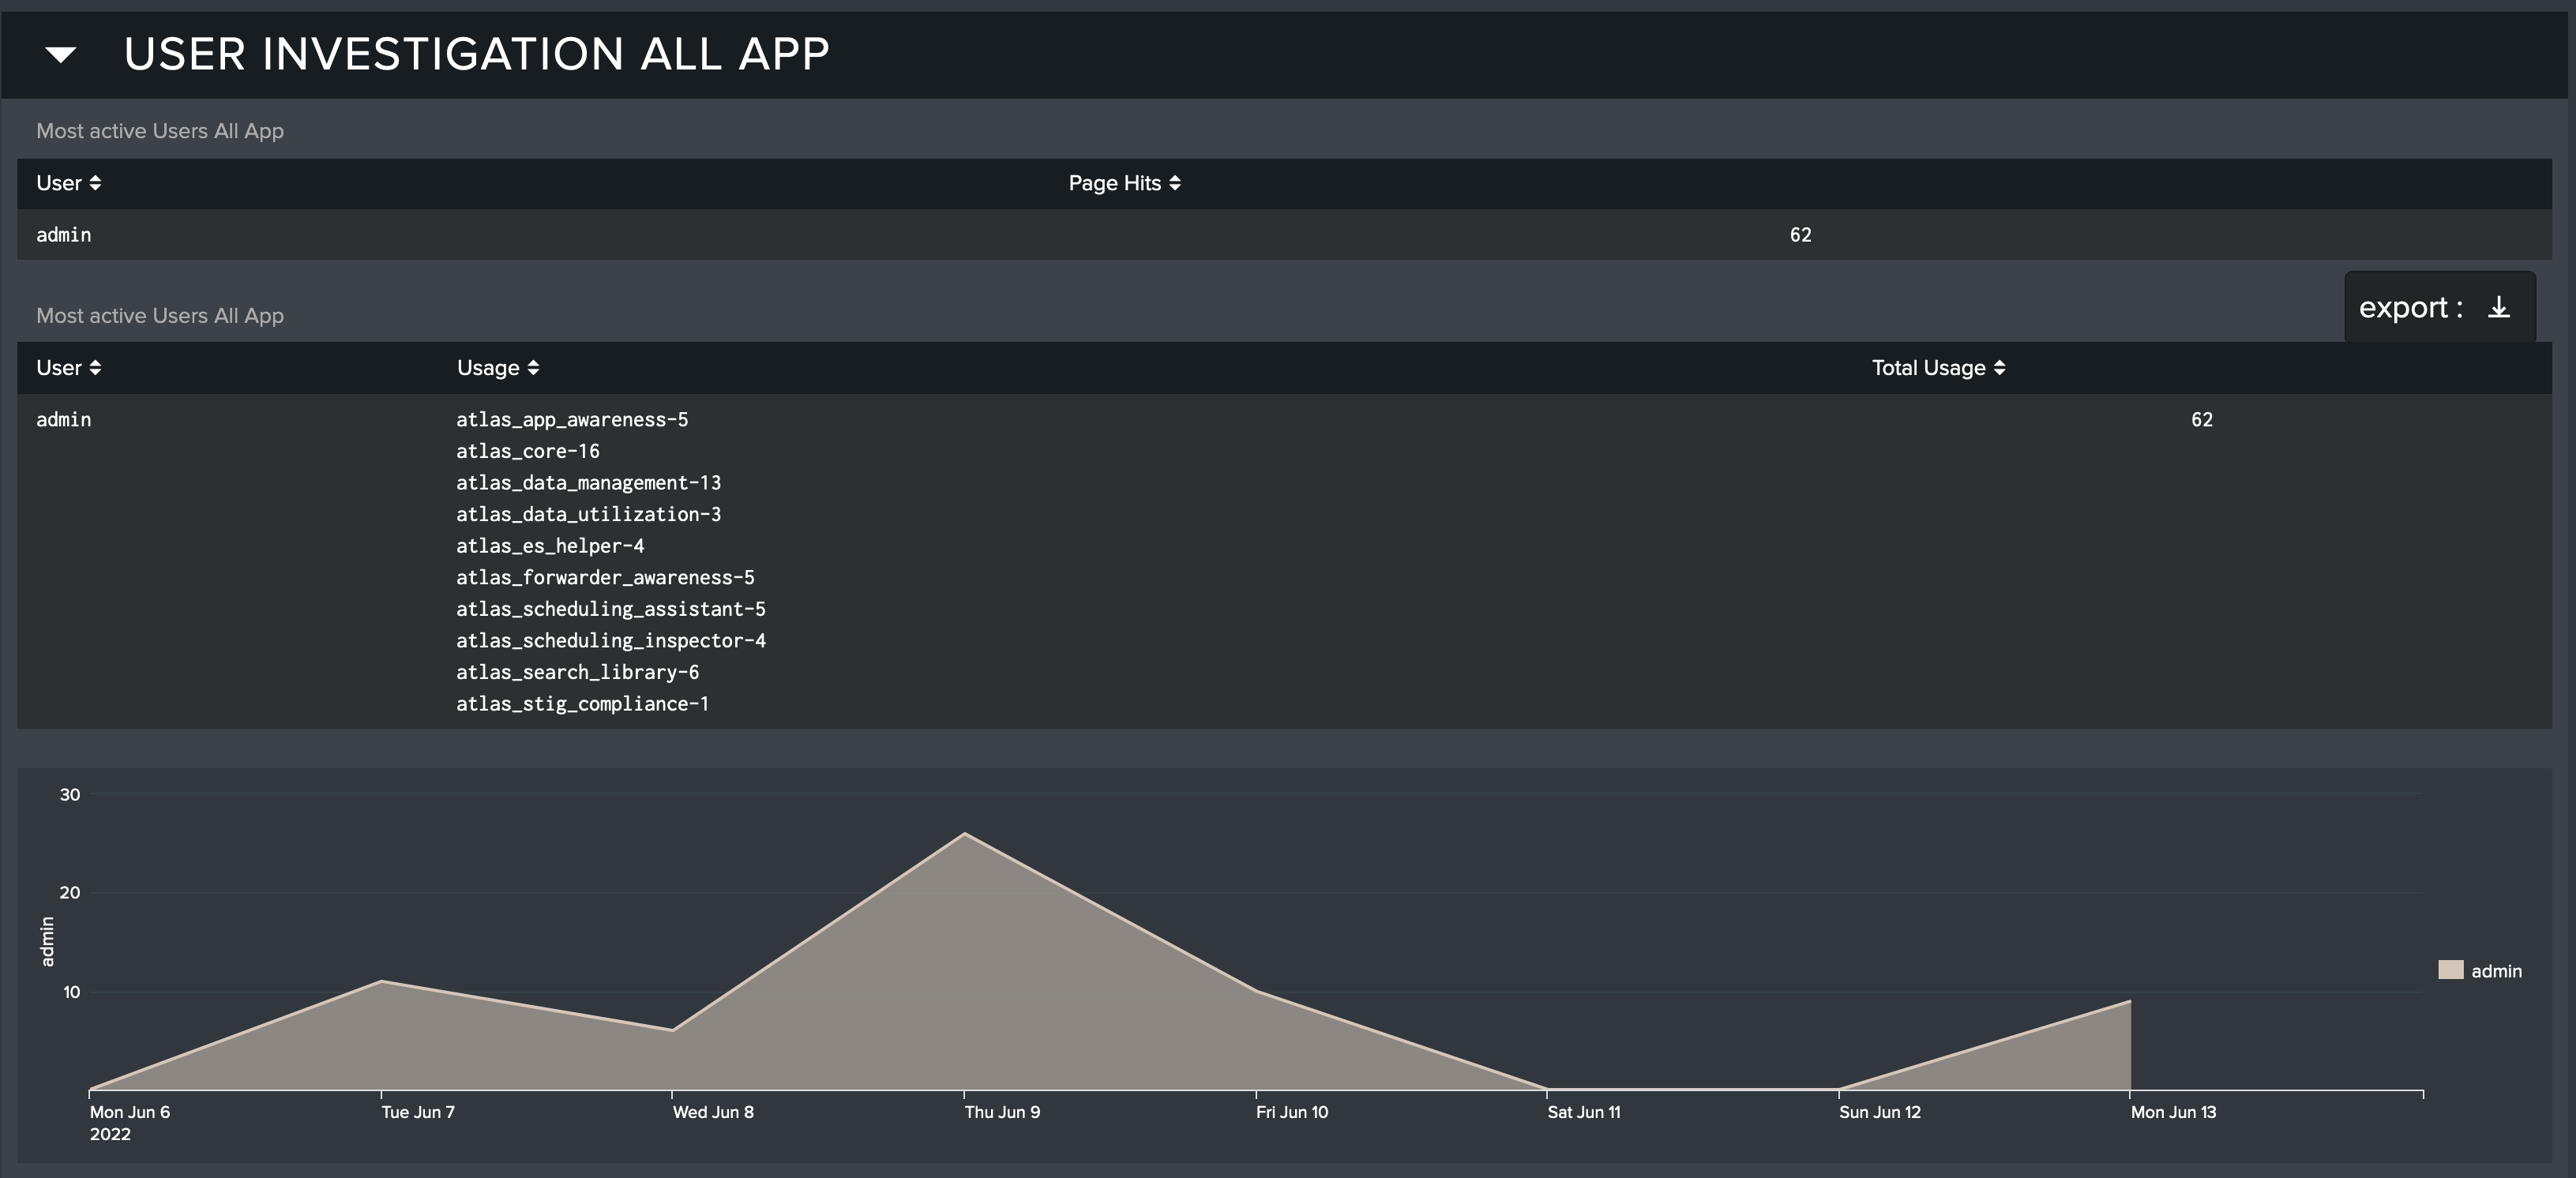
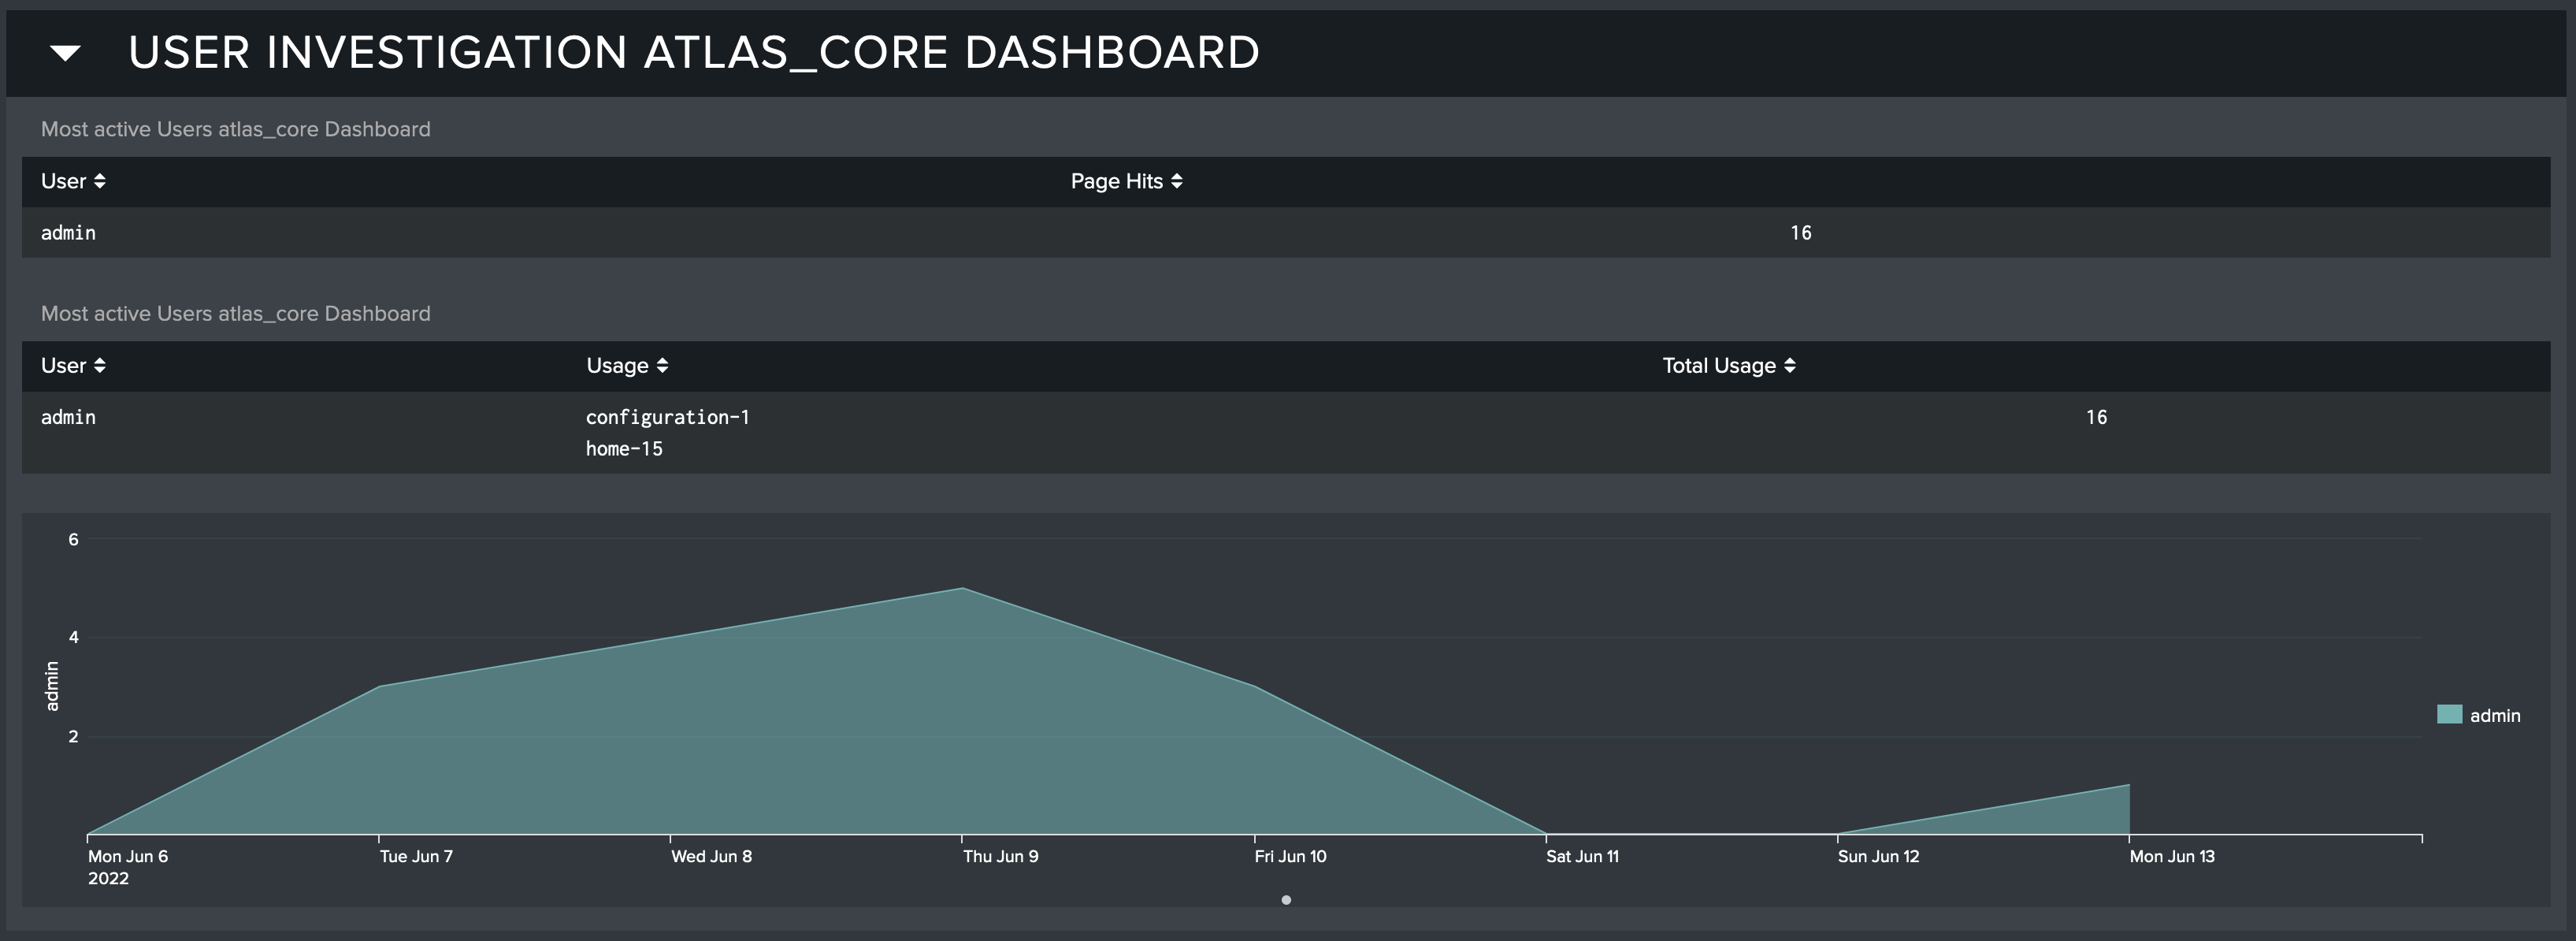
User Investigation
The User Investigation section allows an Admin to view the activity of the Splunk users at a deeper level - which users visit each app (all Apps) or dashboard (specific app selected) and how often, with tabular data as well as a chart depicting per-user app or dashboard usage over the last week (or selected time period).
App Tracking Dashboard
The App Tracking dashboard focuses on providing a clear view into the versions of Splunk applications deployed in your environment. Having different versions of apps running in the indexer and search head layers may cause search inconsistencies in alerts, dashboards, reports, and ad-hoc user search results. This can be very problematic in a Splunk environment and go undetected for a long time - the App Tracking dashboard will quickly identify these potential issues and where to apply fixes.
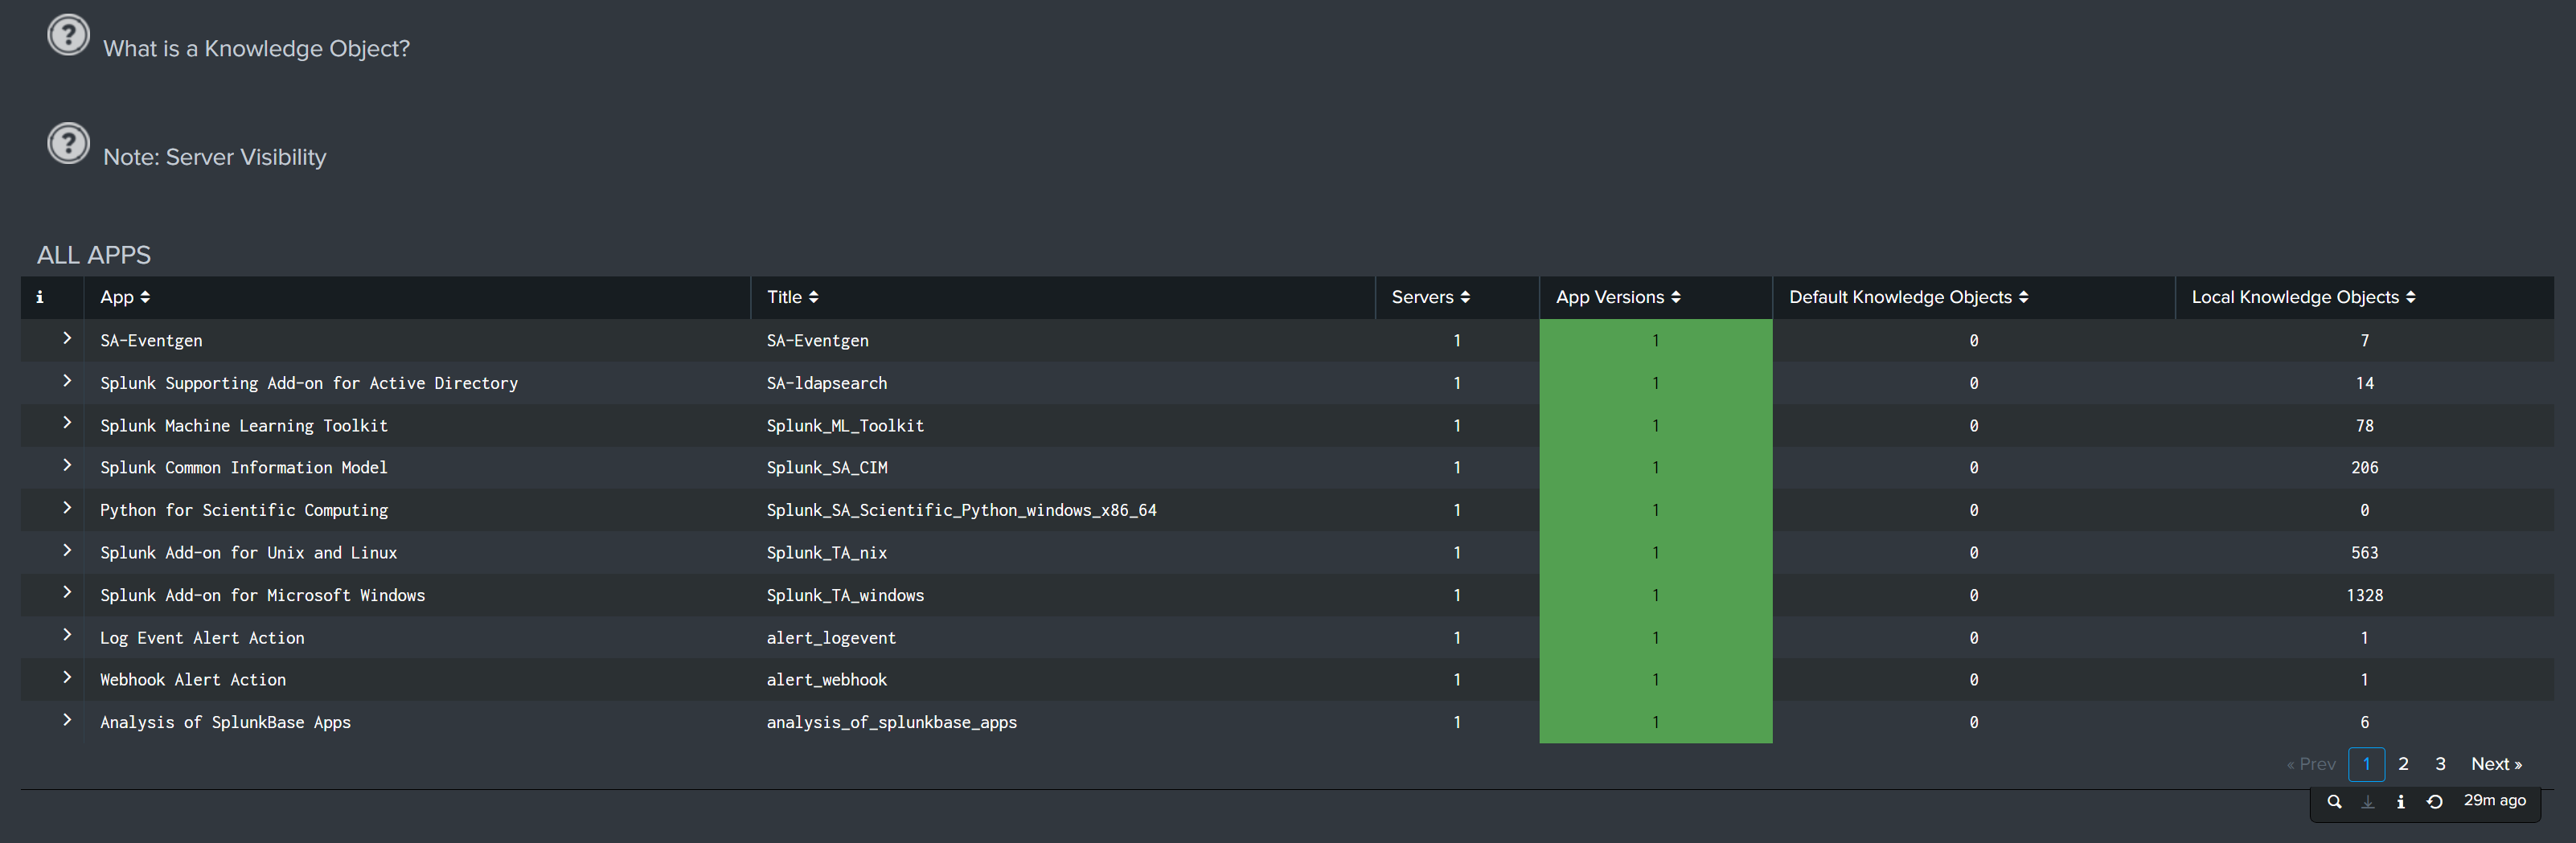
At the top of the dashboard are three KPIs indicating the number of Splunk apps with inconsistent versions, the number of unique apps, and the number of Splunk servers these apps are installed on. Below the KPIs is useful Help information.
![]()
In the image above, we can see that none of the 29 Splunk applications deployed in our environment have different versions running, which is good. If this check had identified an inconsistent version, we could select the problematic App from the All Apps list and see what versions are installed on which Splunk components, which makes it much easier to determine where upgrades should be applied.
Below the KPIs and help information, the All Apps section lists all of the currently installed Apps along with summary information for each app - number of servers each app is installed on, how many versions of that app have been detected, and the number of default and local Knowledge Objects.
Knowledge Object Tracking
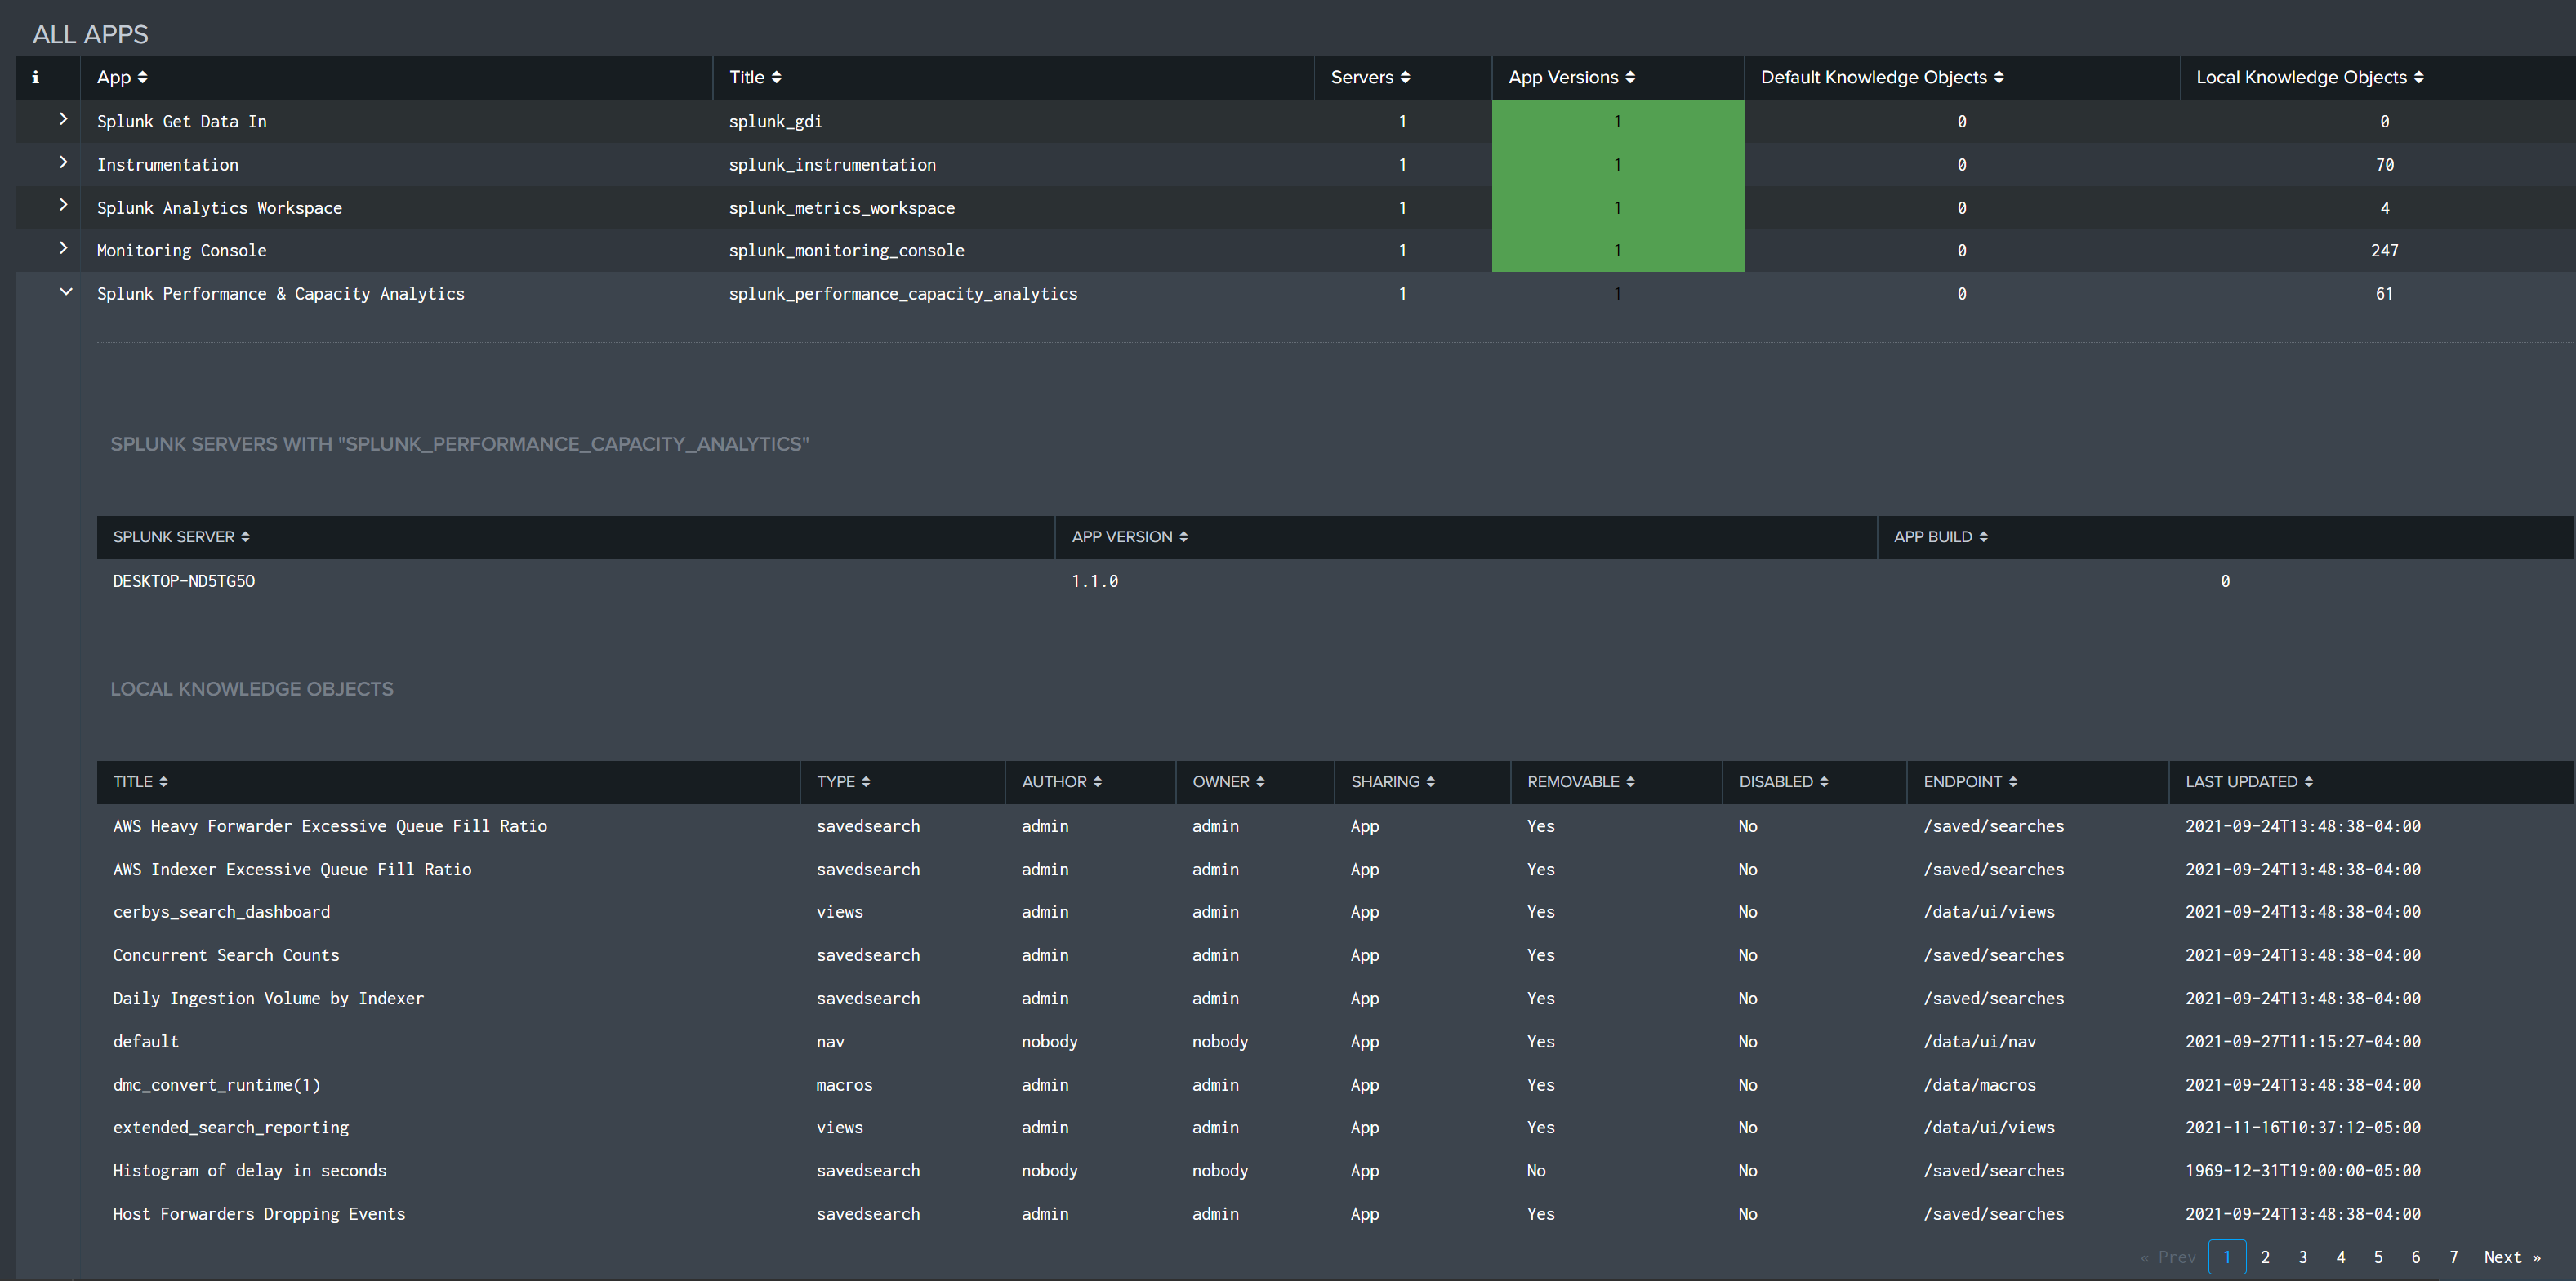
Clicking on the arrow (>) to the left of any app in the All Apps list will expand its information, displaying the app version and build for each Splunk Server that app is installed on.
The expanded information for an app includes a list of all the known knowledge objects for that app, their type, owner, who can see them, where they are stored, and the last time that KO was updated.
Tracking local knowledge objects is notoriously difficult without a tool like App Awareness - and this information is crucial for troubleshooting problematic apps, planning a migration to other Splunk servers, or considering a move from Splunk On-premise to Splunk Cloud.
The app-specific results and summary information for all apps can be exported in .CSV, .XML, or .JSON format by clicking the Export button that appears in the top right of the table.
![]()