Using Splunk Performance and Capacity Analytics

Splunk Performance & Capacity Analytics
The Splunk Performance and Capacity Analytics (PCA) element provides a single-pane-of-glass view into the status, performance, and resource utilization trends across your Splunk Enterprise deployment. It delivers the most useful metrics available in the Splunk Monitoring Console and several essential views not available elsewhere, all without navigating multiple dashboards.
PCA also provides historical and trend data useful for troubleshooting immediate issues and performing longer-term resource and license usage analysis. This element offers a quick status view of critical performance metrics (availability, indexing integrity, CPU, memory, disk usage, IOPS, and more) that administrators can check regularly to stay ahead of issues.
Splunk Performance & Capacity Analytics Capabilities
- Review high level summary KPIs to quickly identify Splunk component availability or performance issues
- View performance metrics by Splunk tier to quickly identify which component has problems
- Configure quickly with an easy-to-use setup tool
- Visualize historical performance and resource utilization trends for troubleshooting and capacity planning
Recommended Architecture
For clustered Splunk Environments, deploy PCA on a dedicated Search Head that is 'search peered' to all other Splunk search heads to analyze the entire search environment.
The PCA Search Head should also be search peered to these Splunk servers (if they exist) to maximize visibility:
- Splunk Indexing Tier
- License Manager
- Cluster Manager
- Heavy Forwarders
- Deployment Server(s)
- Deployer(s)
For search peering assistance, contact the Customer Experience Team or follow Splunk Documentation.
When deploying PCA in a Search Head Cluster, follow instructions to 'Replicate the search peers across the cluster' in Distributed Search.
System Resources Dashboard
The System Resources dashboard opens by default when PCA starts. It provides a quick overview of critical Splunk performance metrics that can be monitored to prevent issues.
This dashboard automatically updates every 5 minutes.
Note: CPU and Memory metrics in Atlas PCA are reported as the 95th Percentile of values from the sample period. For example, the PCA CPU utilization represents the 95th percentile of all 10-second samples across the 5-minute reporting period, capturing highest nominal values without being skewed by outliers.
Splunk Summary Status
The top of the dashboard shows summary indicators of critical Splunk performance metrics.
The first row of KPIs shows status of essential Splunk services and data integrity. The second row shows critical performance KPIs with thresholds (yellow for warning, red for alert).
These KPIs help identify areas needing investigation:
- License Manager Reachable
- Cluster Manager Reachable
- All Data Searchable
- Replication Factor Met
- Search Factor Met
- Indexing Queuing Severity
- Max Ingestion Rate - MBps
- Max Indexer CPU Util Pct
- Max Search Head CPU Util Pct
- Est Per-Indexer Ingest - GB/Day
Splunk Server Status
This section shows overall availability and health of your Splunk servers, with counts by status for each server type.
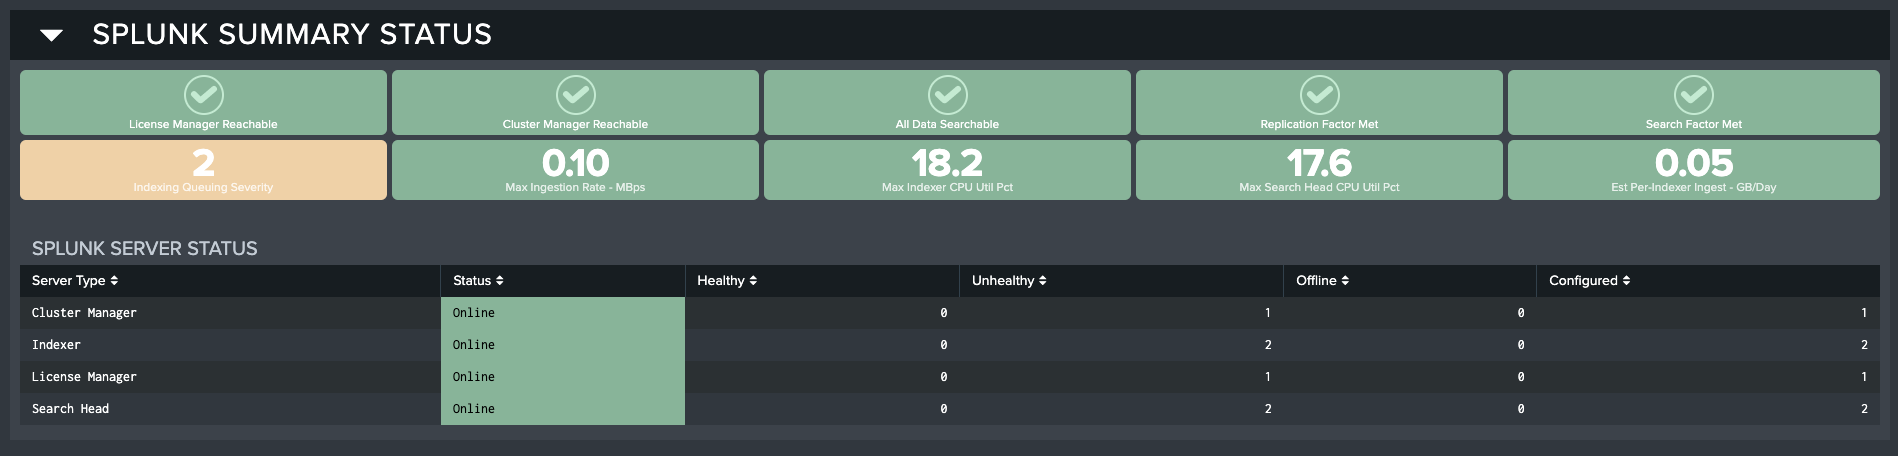
The Splunk Server Status table fields include:
- Server Type: Server type based on role assignment
- Status: Online or Offline
- Healthy: Count of healthy servers of this type
- Unhealthy: Count of unhealthy servers of this type
- Offline: Count of offline servers of this type
- Configured: Count of configured (expected online) servers of this type
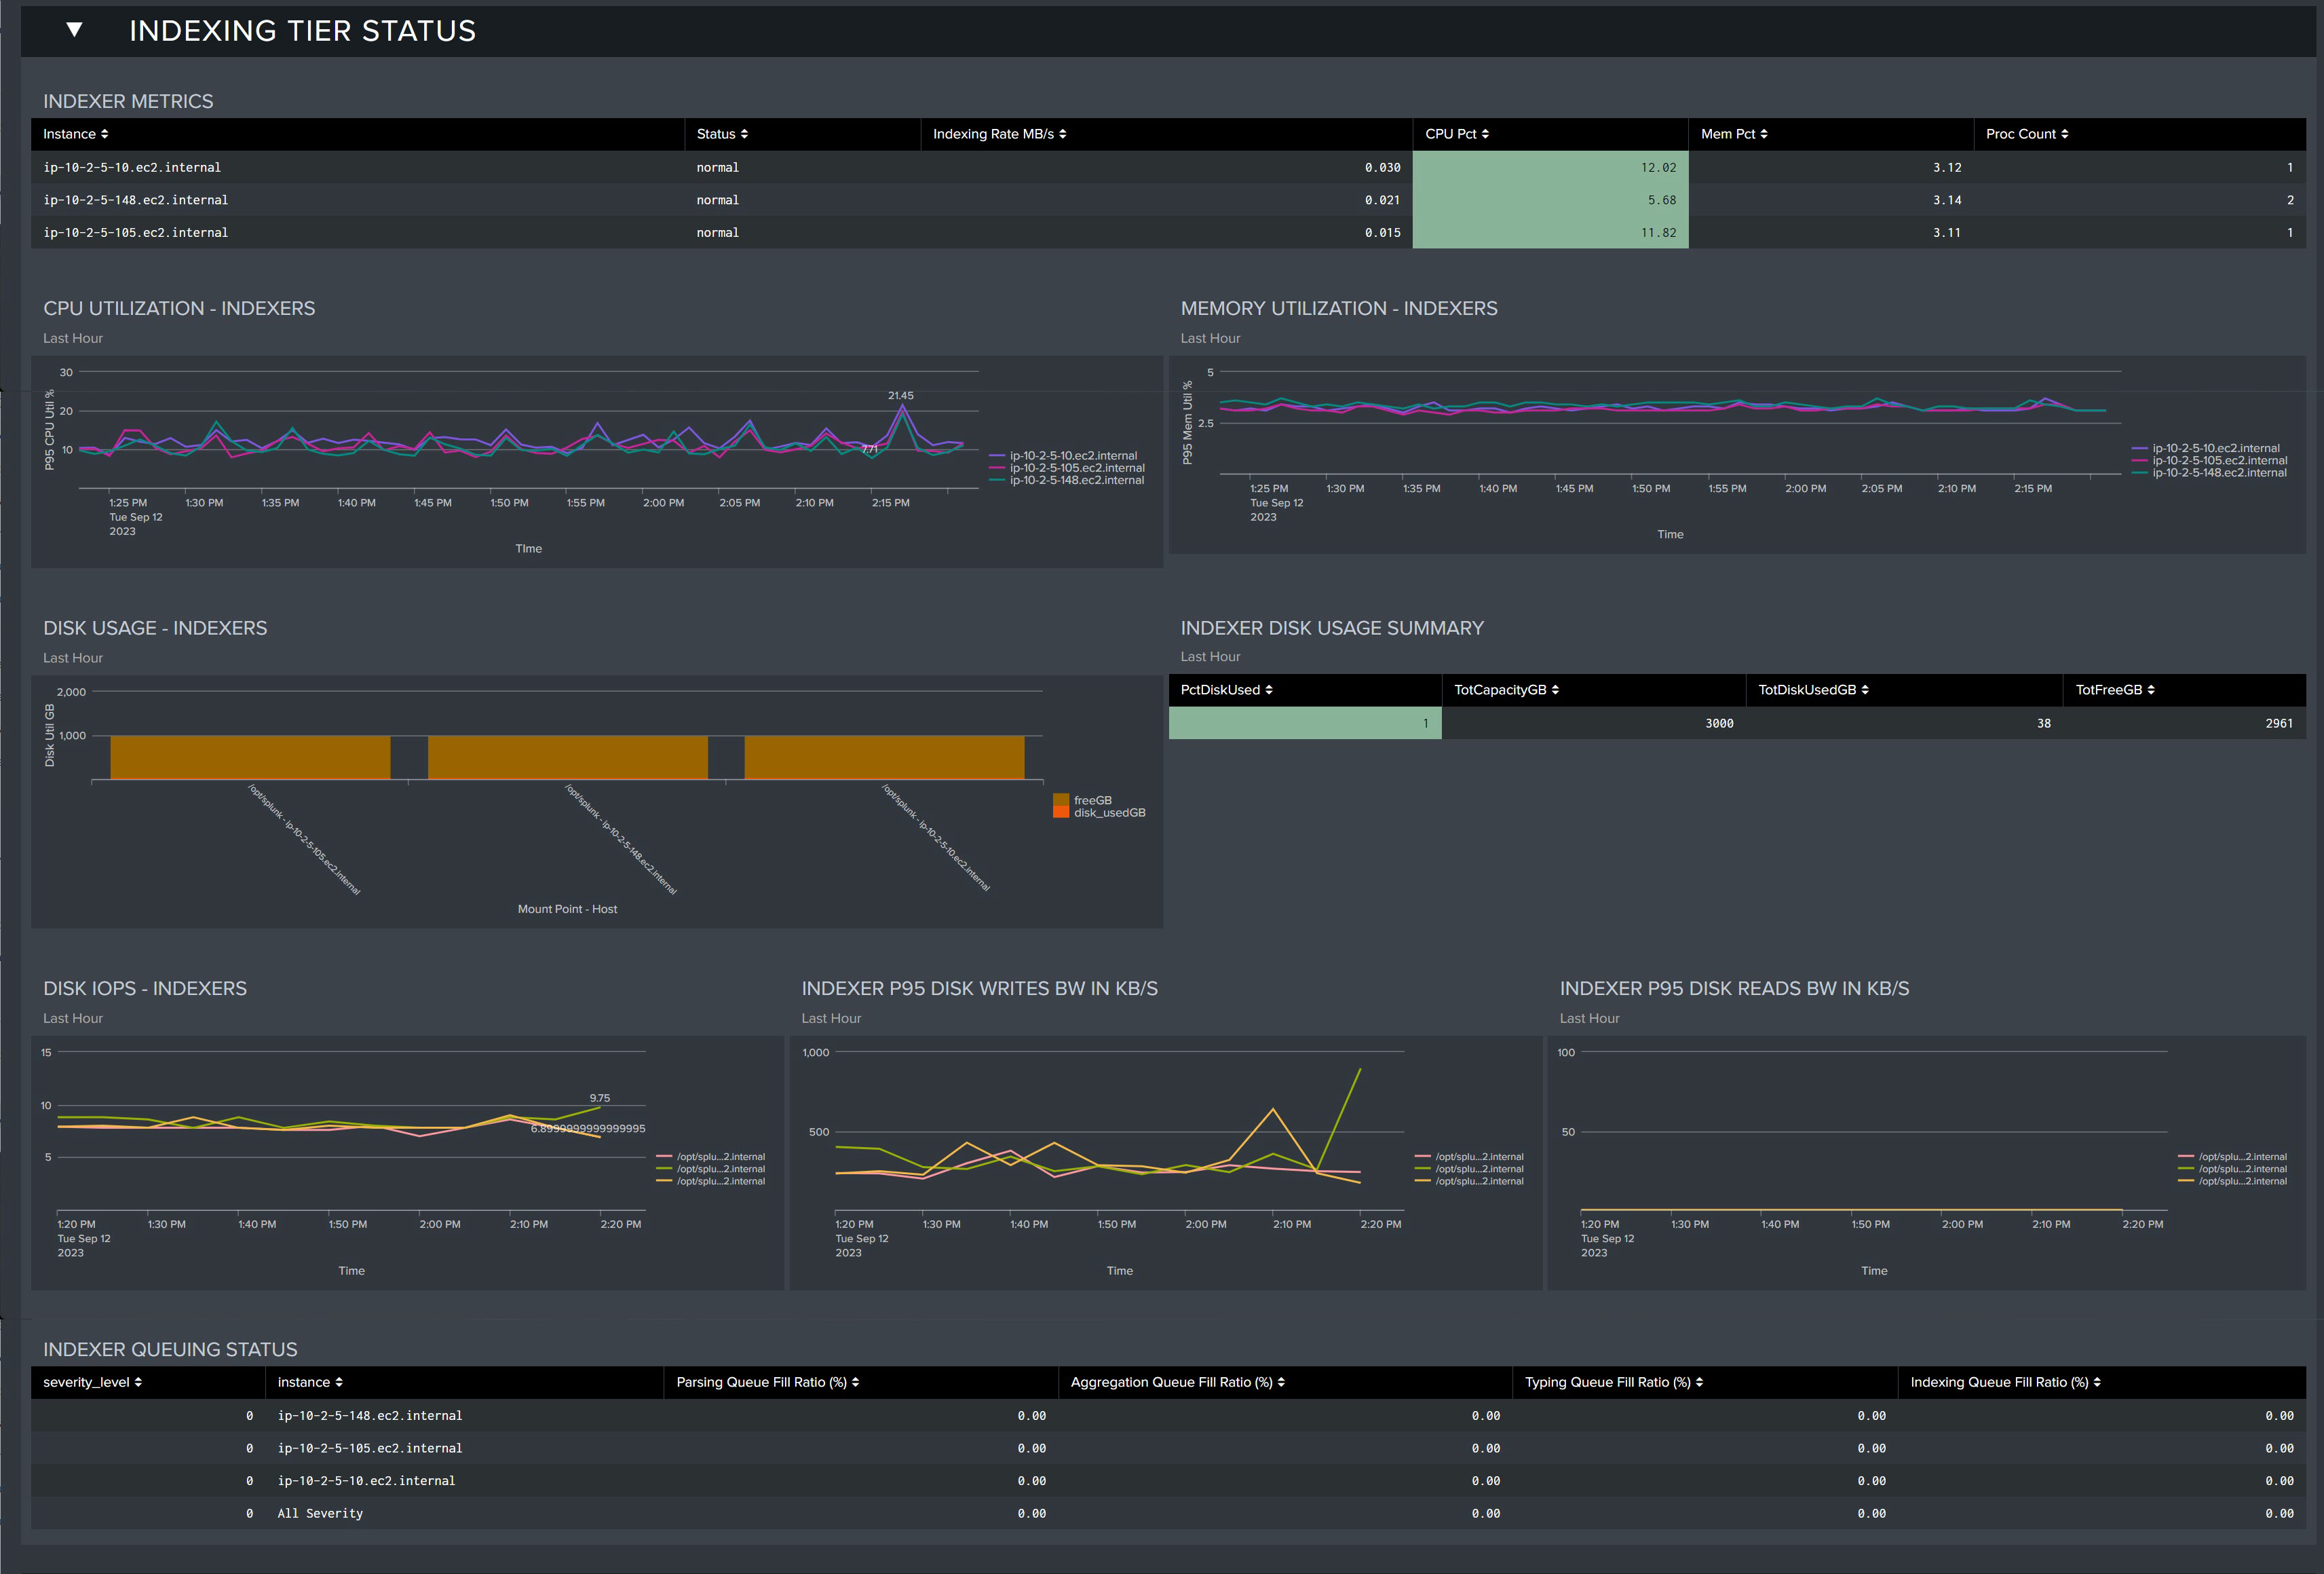
Indexing Tier Status
This section shows key performance metrics for your indexing tier servers, helping identify current or developing problems.
-
Indexer Metrics: Table showing health status of each indexer
- Instance: Indexer server name
- Status: Current status
- Indexing Rate MB/s: Data ingestion rate per second
- CPU Pct: CPU utilization percentage
- Mem Pct: Memory utilization percentage
- Proc Count: Process count
-
CPU Utilization - Indexers: CPU trends for all indexers in the last hour
-
Memory Utilization - Indexers: Memory usage for all indexers in the last hour
-
Disk Usage - Indexers: Disk utilization for each indexer in the last hour
-
Indexer Disk Usage Summary: Table showing disk metrics for the last hour
- PctDiskUsed: Disk usage percentage
- TotCapacityGB: Total capacity in GB
- TotDiskUsedGB: Total disk used in GB
- TotFreeGB: Total free space in GB
-
Disk IOPS - Indexers: Measured IOPS for indexer disk storage
-
Indexer P95 Disk Writes BW in KB/S: 95th percentile disk write bandwidth in KB/s
-
Indexer P95 Disk Reads BW IN KB/S: 95th percentile disk read bandwidth in KB/s
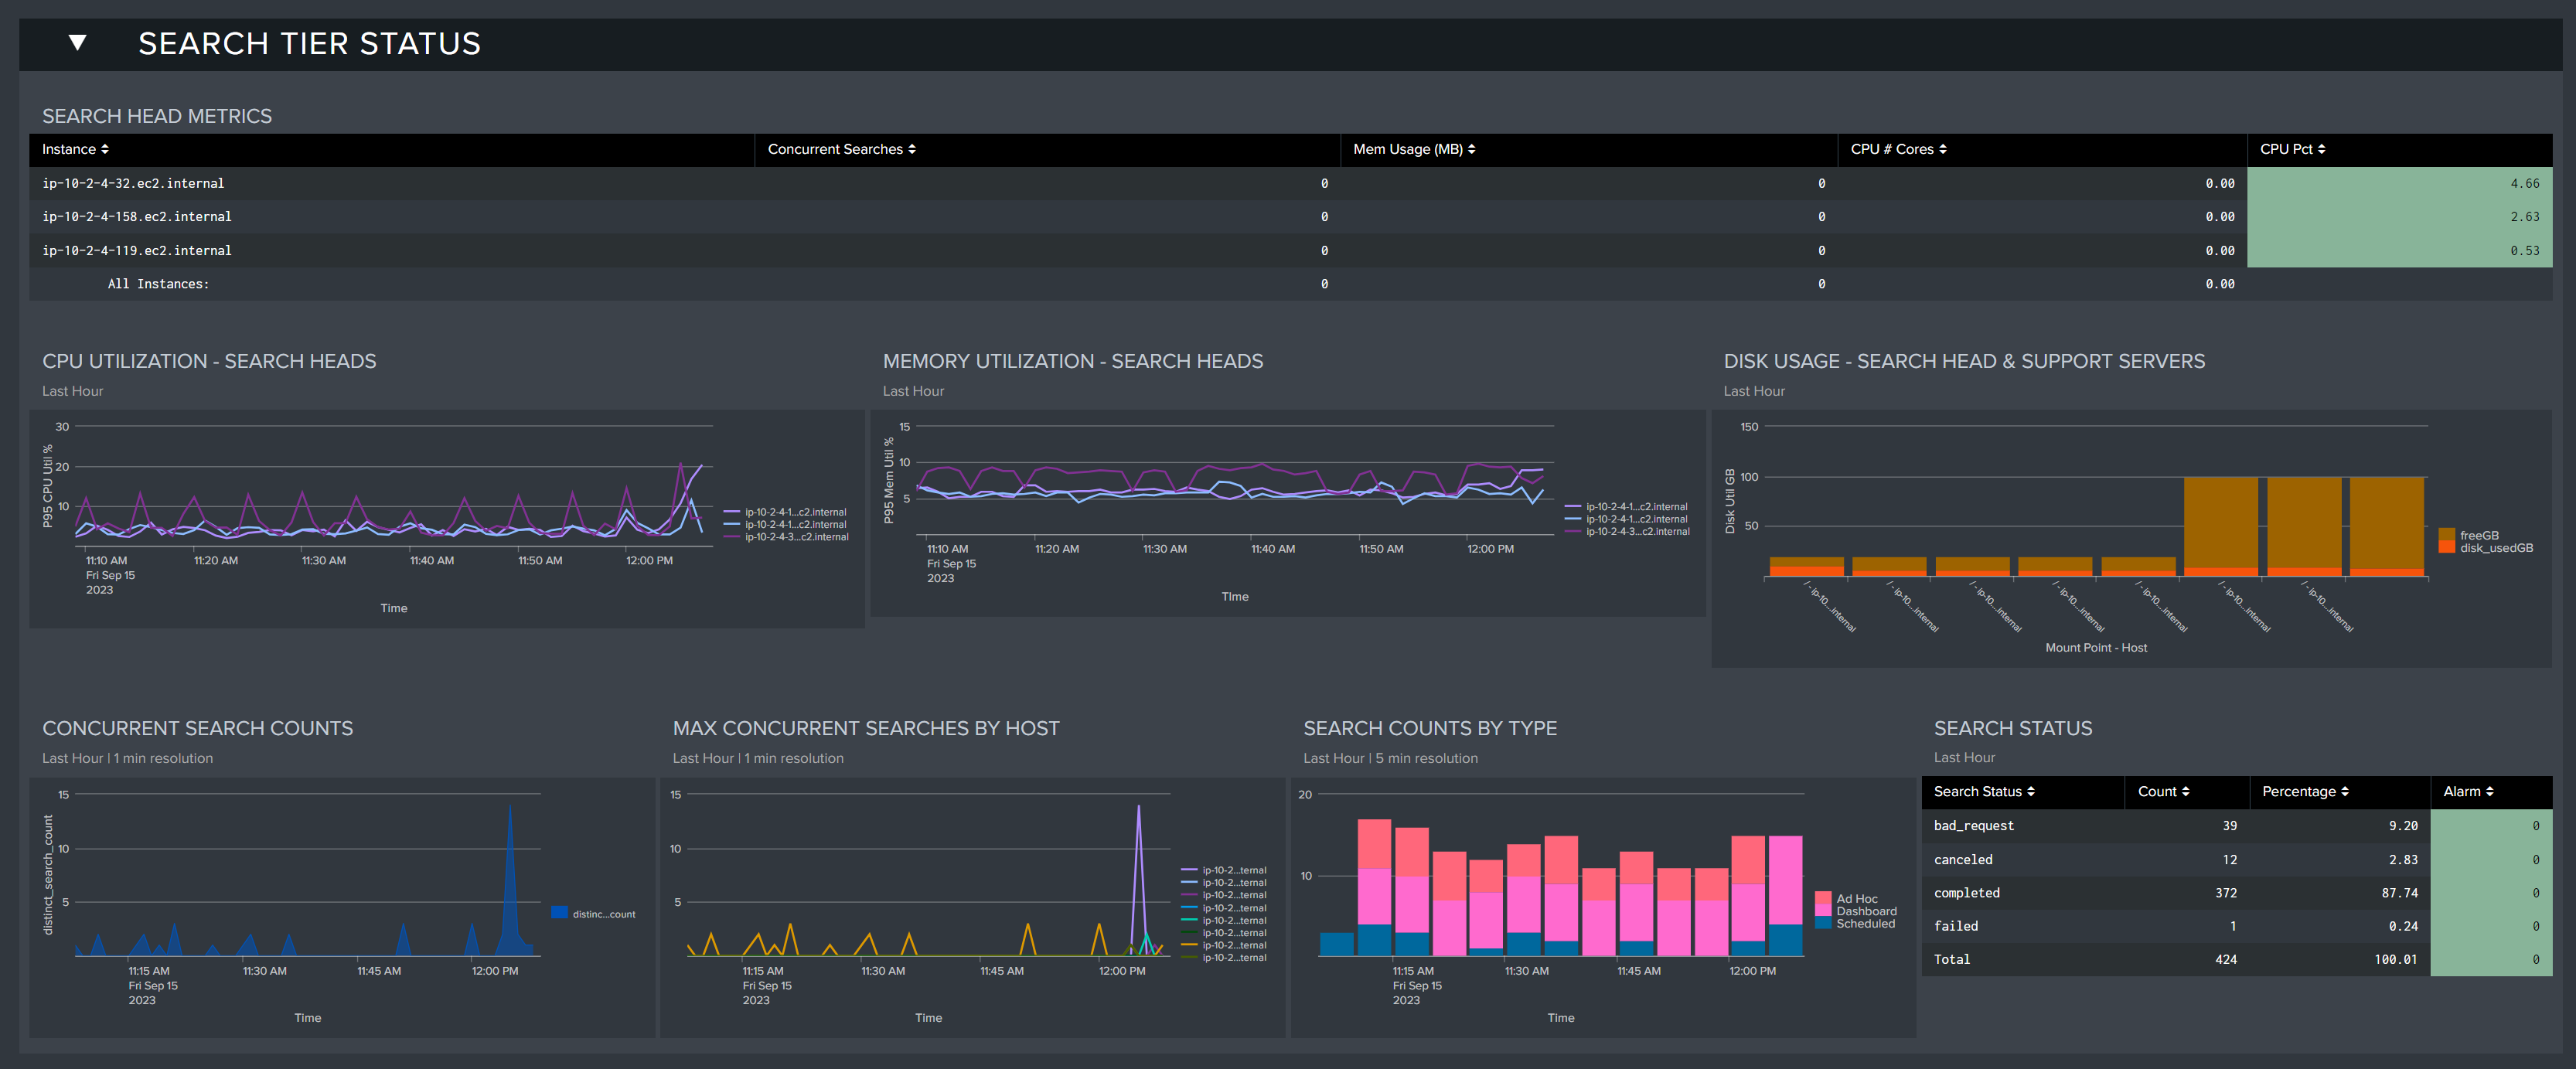
Search Tier Status
This section shows key metrics for your search head tier servers.
-
Search Head Metrics: Table showing status of each search head
- Concurrent Searches: Number of concurrent searches running
- Mem Usage(MB): Memory usage in MB
- CPU # Cores: Number of CPU cores being utilized
- CPU Pct: CPU utilization percentage
-
CPU Utilization - Search Heads: CPU trends for all search heads in the last hour
-
Memory Utilization - Search Heads: Memory usage for all search heads in the last hour
-
Concurrent Search Counts: Concurrent searches in the last hour
-
Max Concurrent Searches by Host: Maximum concurrent searches by host in the last hour
-
Search Counts by Type: Searches by type in the last hour (Ad Hoc, Dashboard, Scheduled)
-
Search Status: Search status in the last hour (Canceled, Completed, Granted, Total)
Search status types include:
- Granted: Search allowed to run when resources are available
- Completed: Finished search
- Failed: Search unable to run (scheduling issues)
- Cancelled: Search terminated due to resource constraints or timeout
Failed searches should be fixed using Atlas Search Inspector and Search Assistant elements.
Support Tier Status
This section shows resource metrics for support servers (cluster manager, deployment server, license manager).
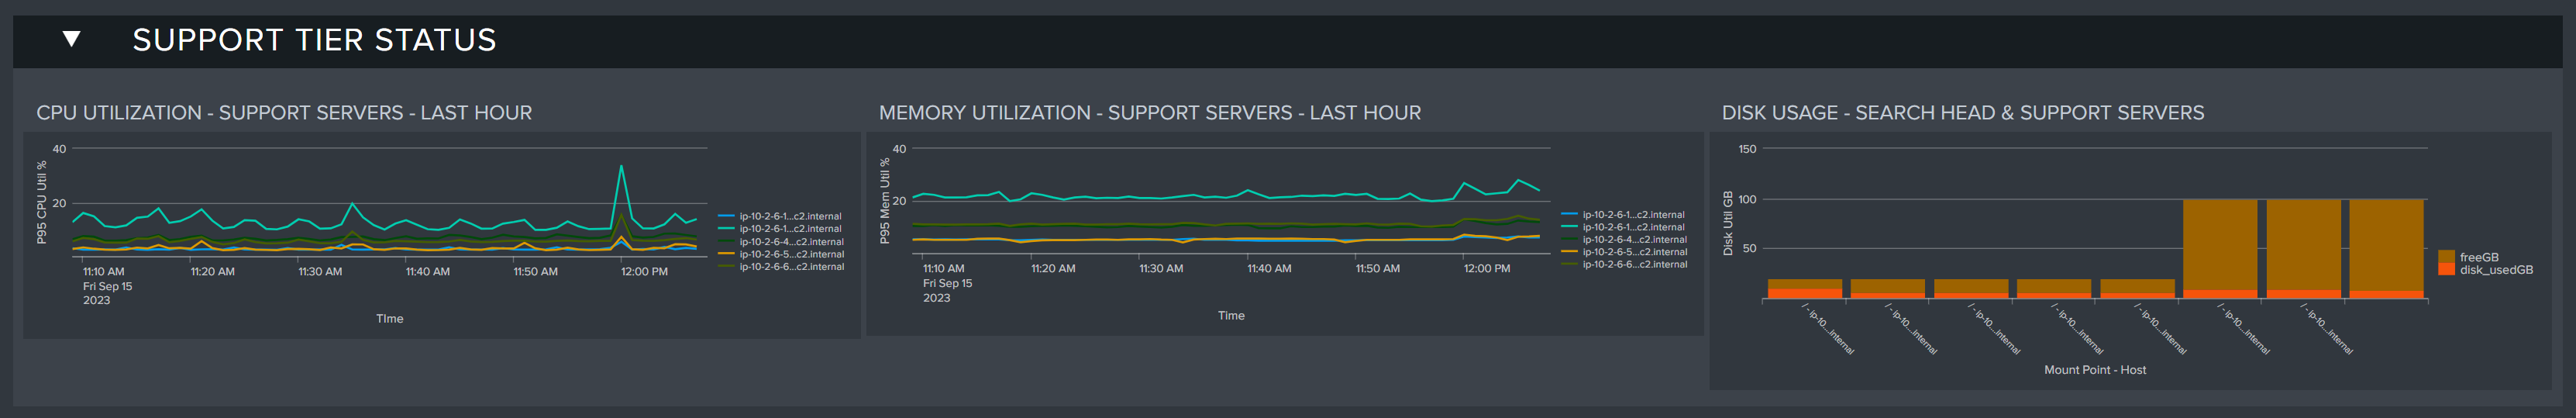
- CPU Utilization-Support Servers-Last Hour: CPU usage of support servers in the last hour
- Memory Utilization - Support Servers - Last Hour: Memory usage of support servers in the last hour
- Disk Usage - Search Head & Support Servers: Disk usage for search head and support servers in the last hour
Ingest Status
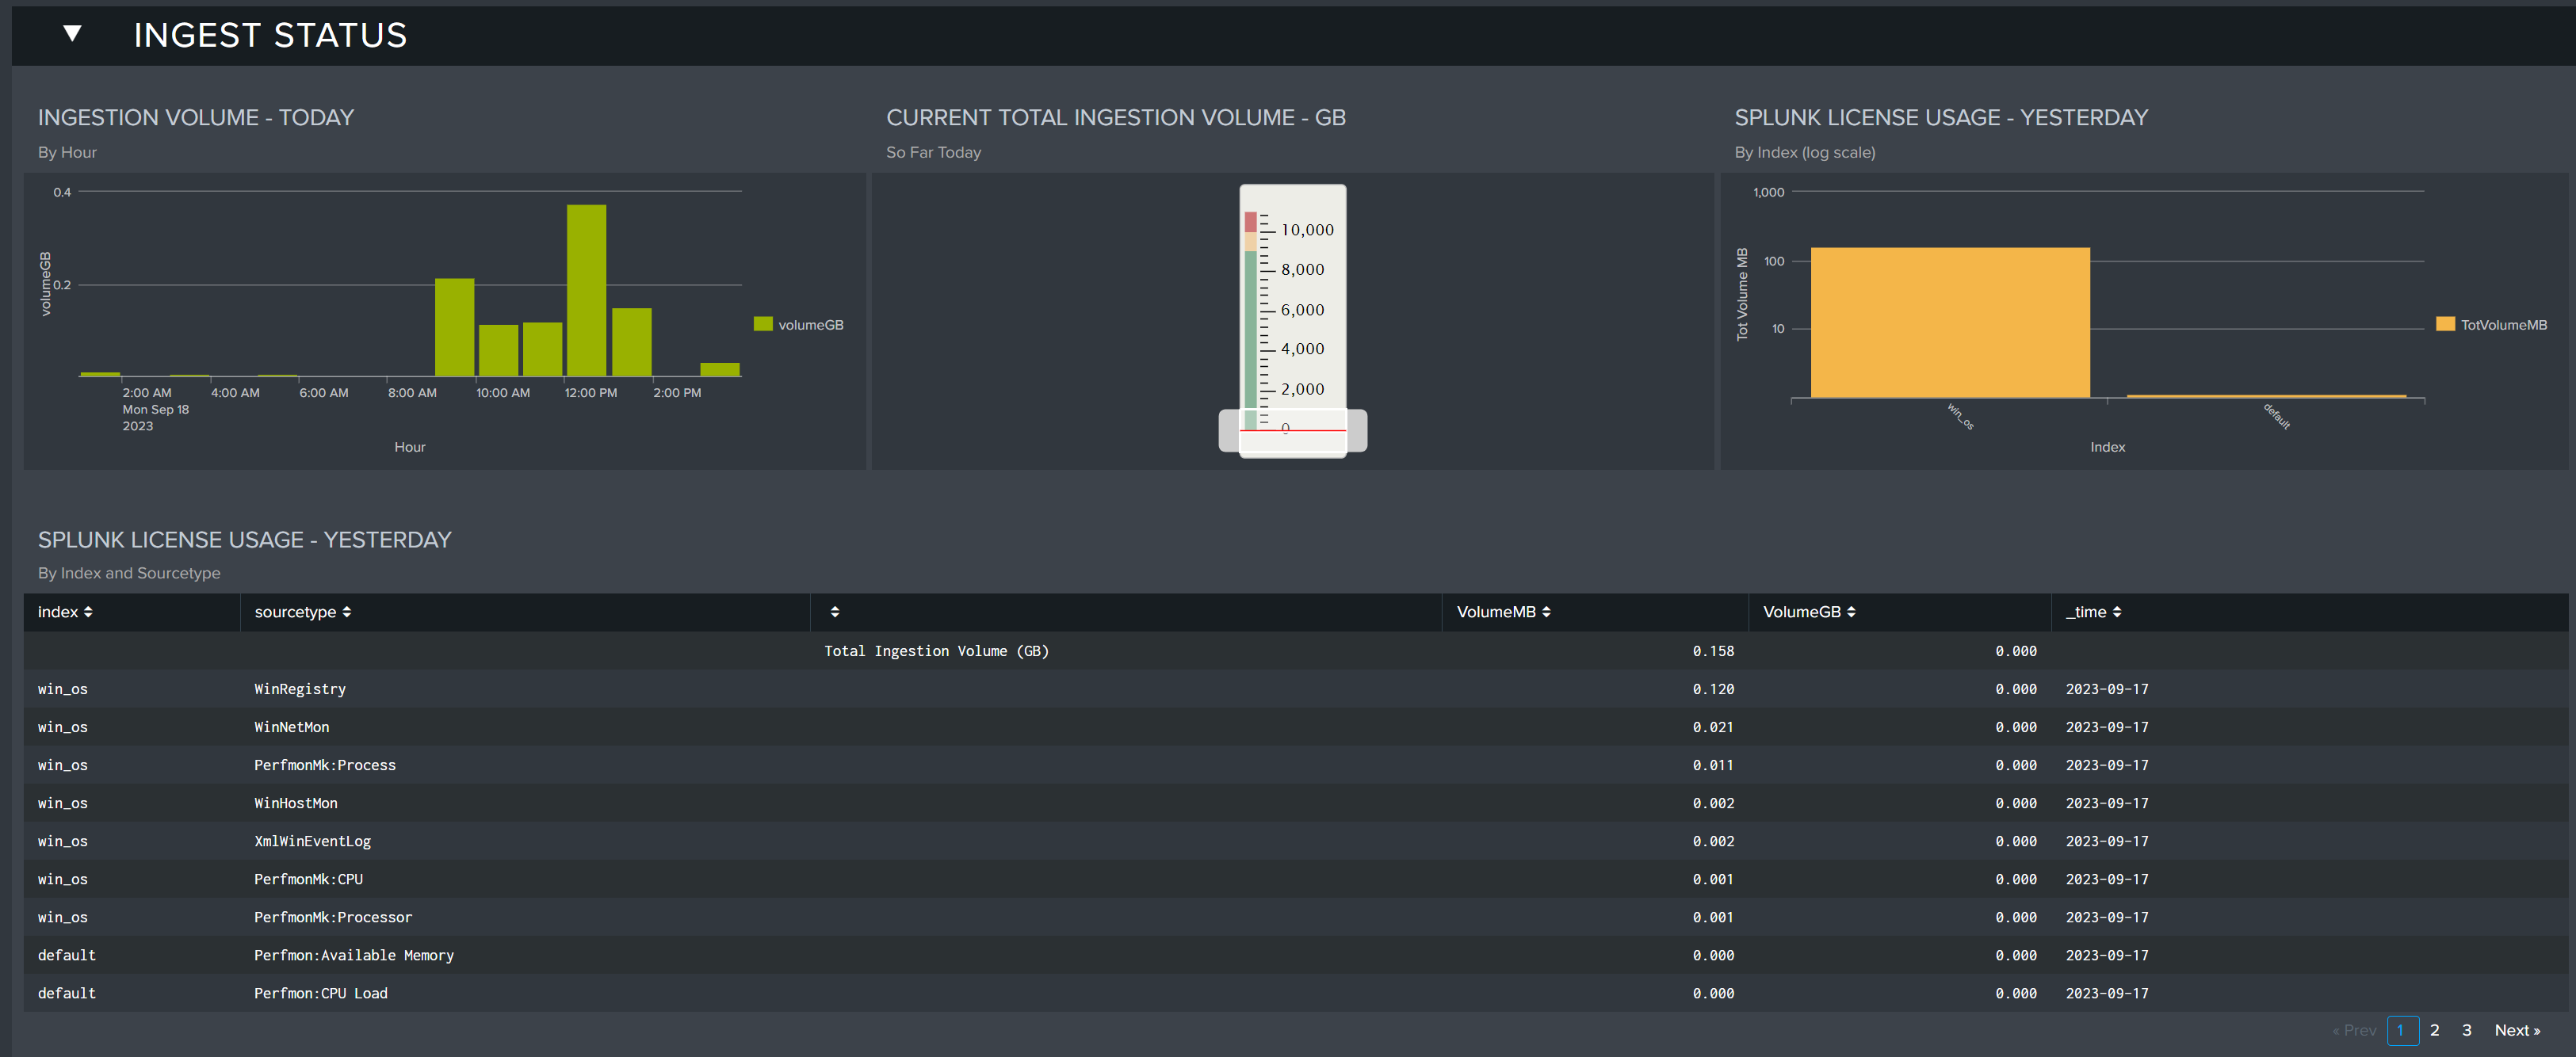
This section shows data ingest across current and previous days, helping spot discrepancies and spikes by source type.
- Ingest Volume - Today: Hourly ingest volume for today
- Current Total Ingestion Volume - GB: Total ingest volume for today (so far) in GB
- Splunk License Usage - Yesterday: License usage by index for yesterday
- Splunk License Usage - Yesterday: Table of license usage by index and sourcetype for yesterday
Environment Overview
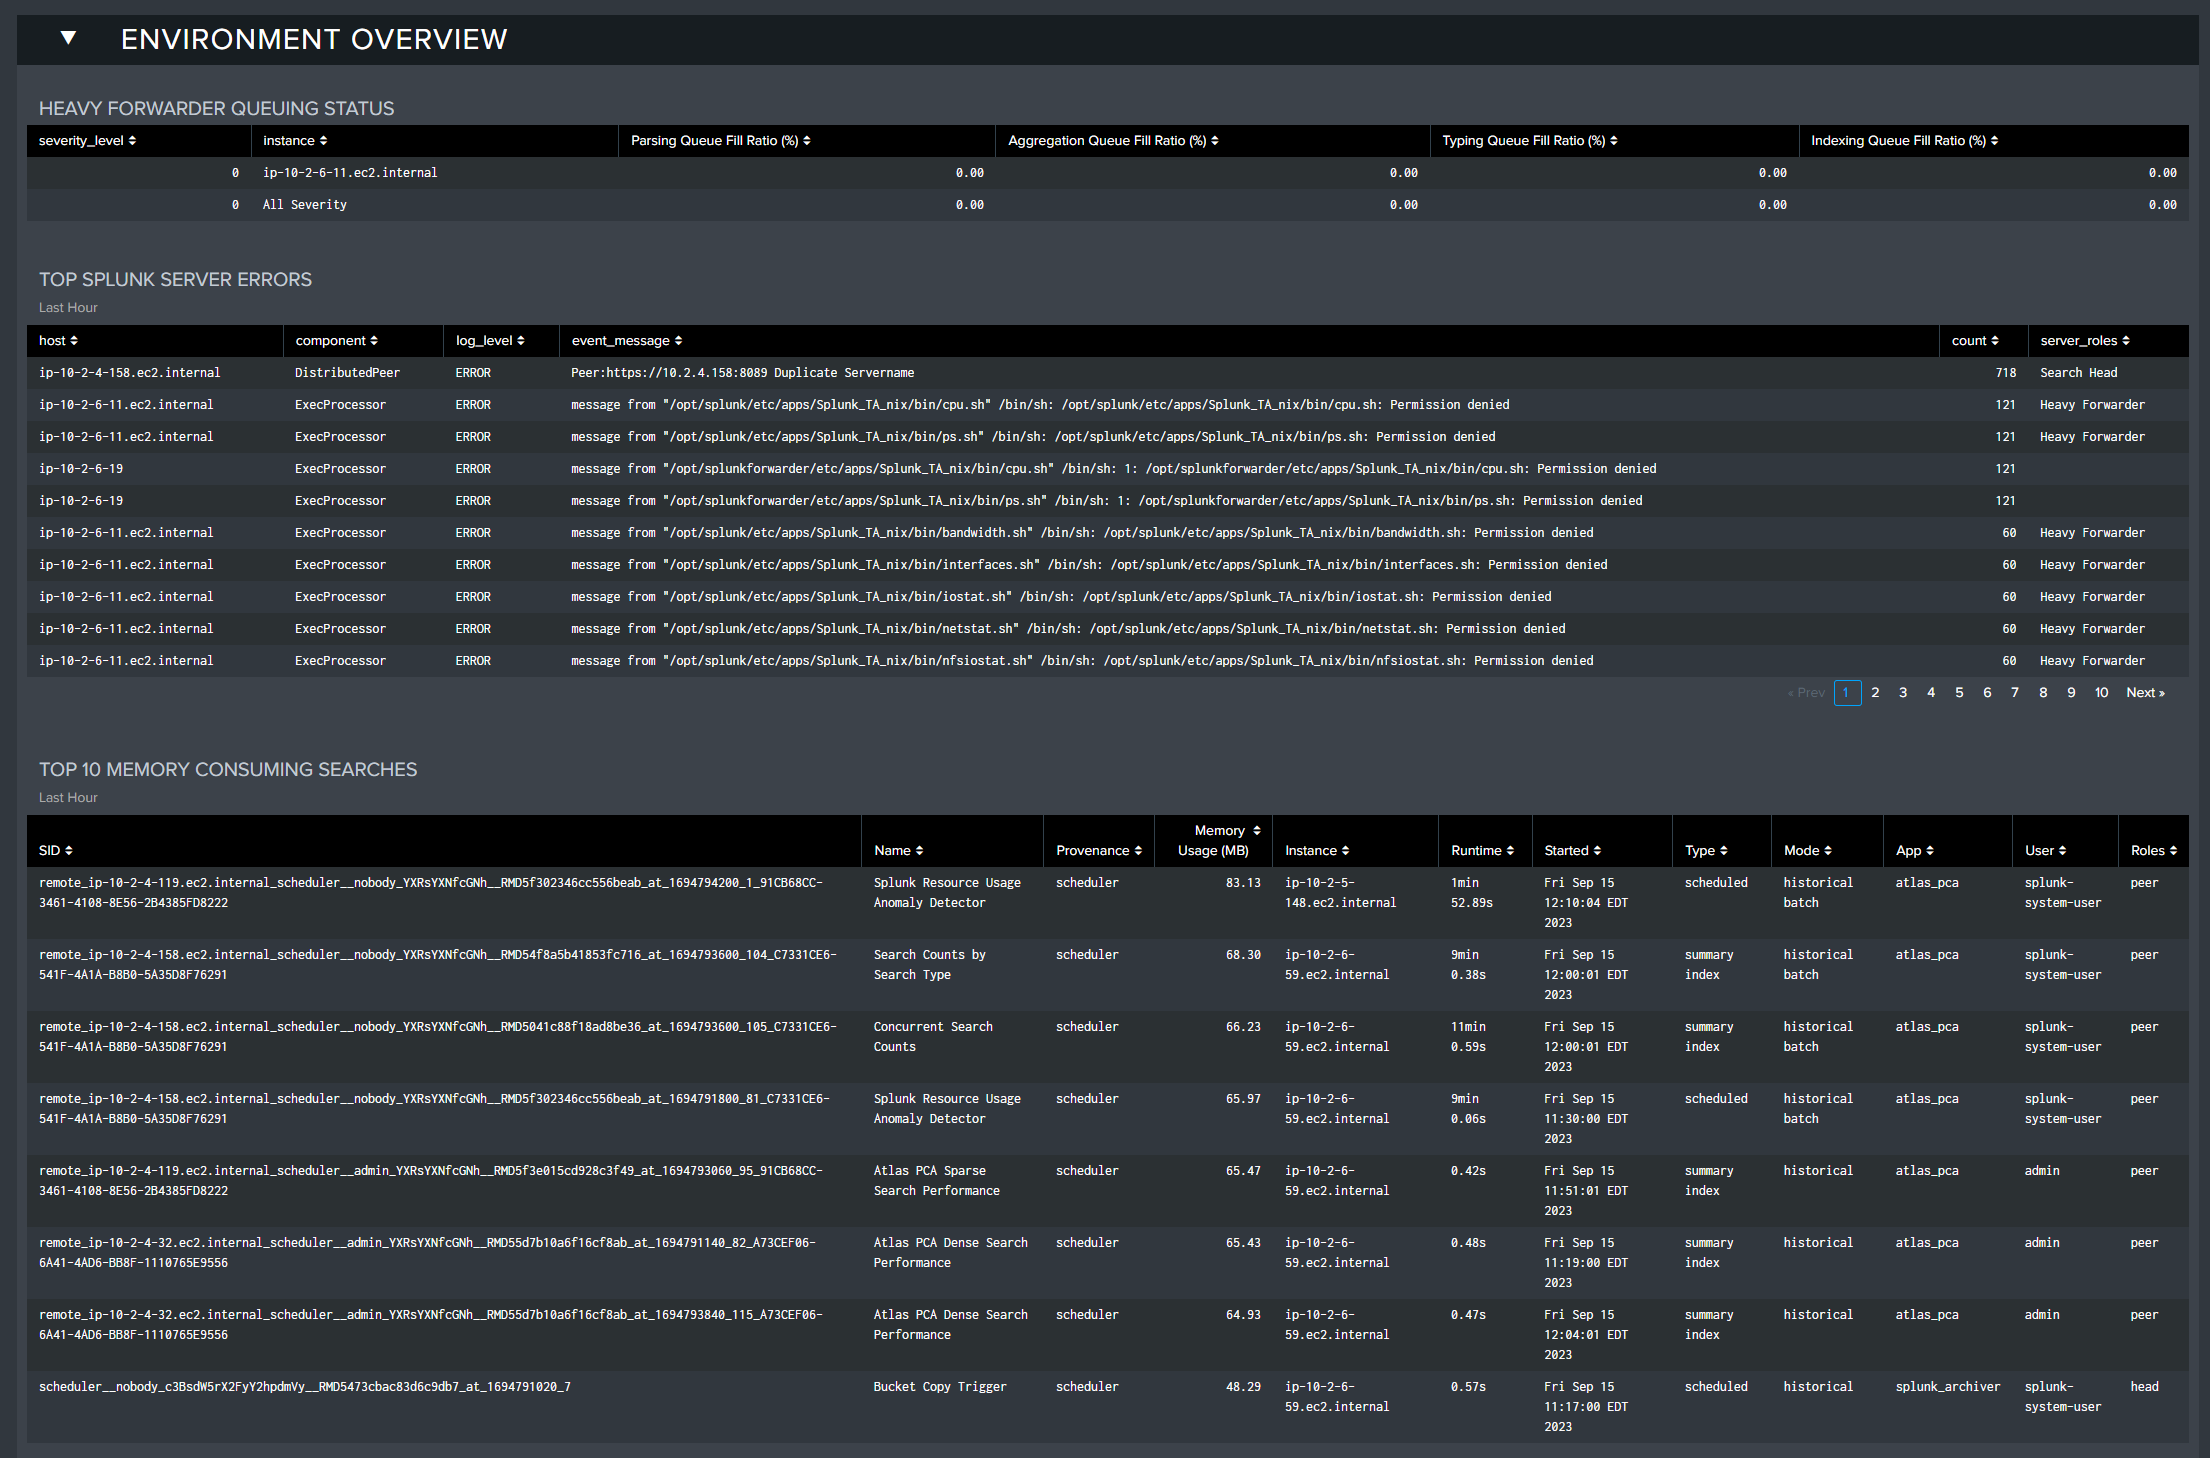
This section reports on various environmental errors, including heavy forwarder queuing issues and resource-intensive searches.
- Heavy Forwarder Queuing Status: HF queuing status if detected
- Top Splunk Server Errors: Top server errors in the last hour by server
- Top 10 Memory Consuming Searches: Most resource-intensive searches in the last hour
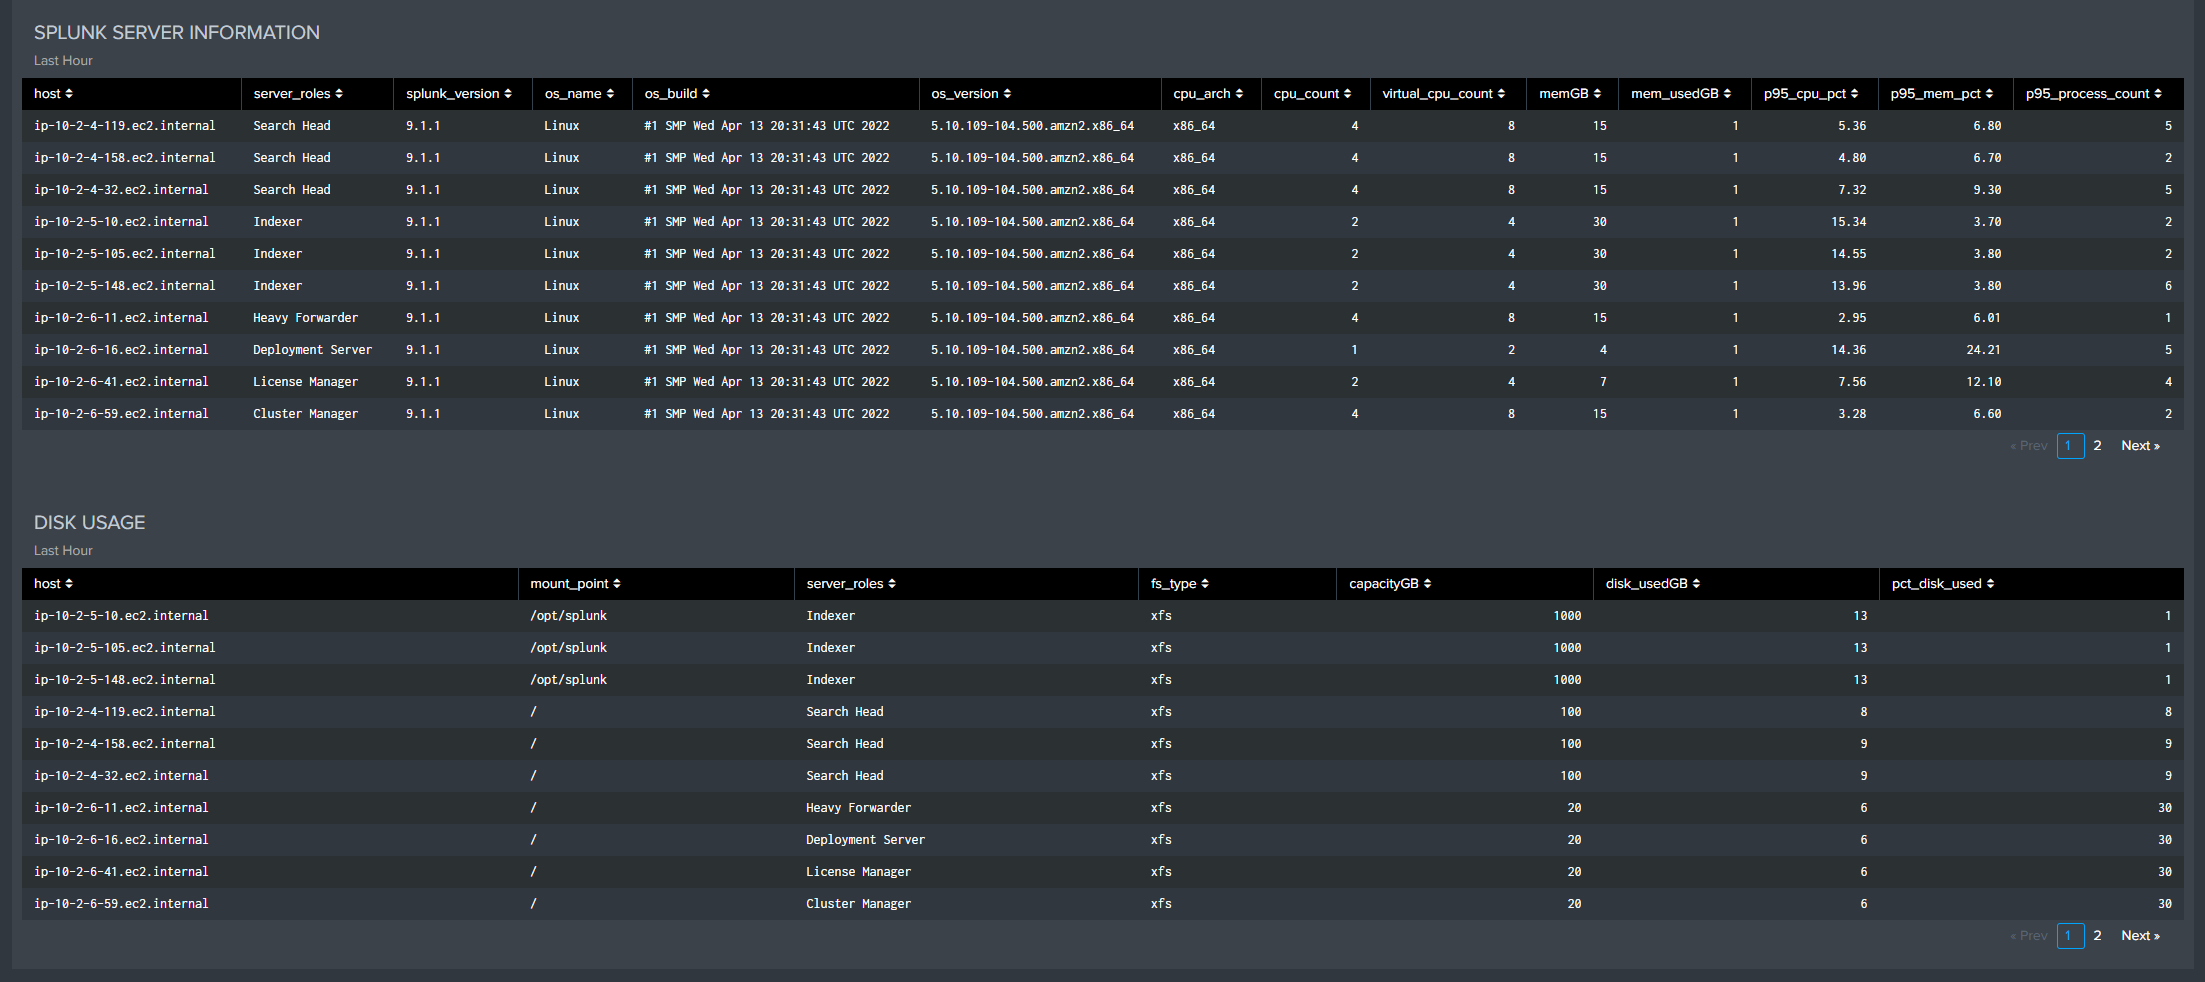
- Splunk Server Information: Server details from the last hour
- Disk Usage: Disk usage by server in the last hour
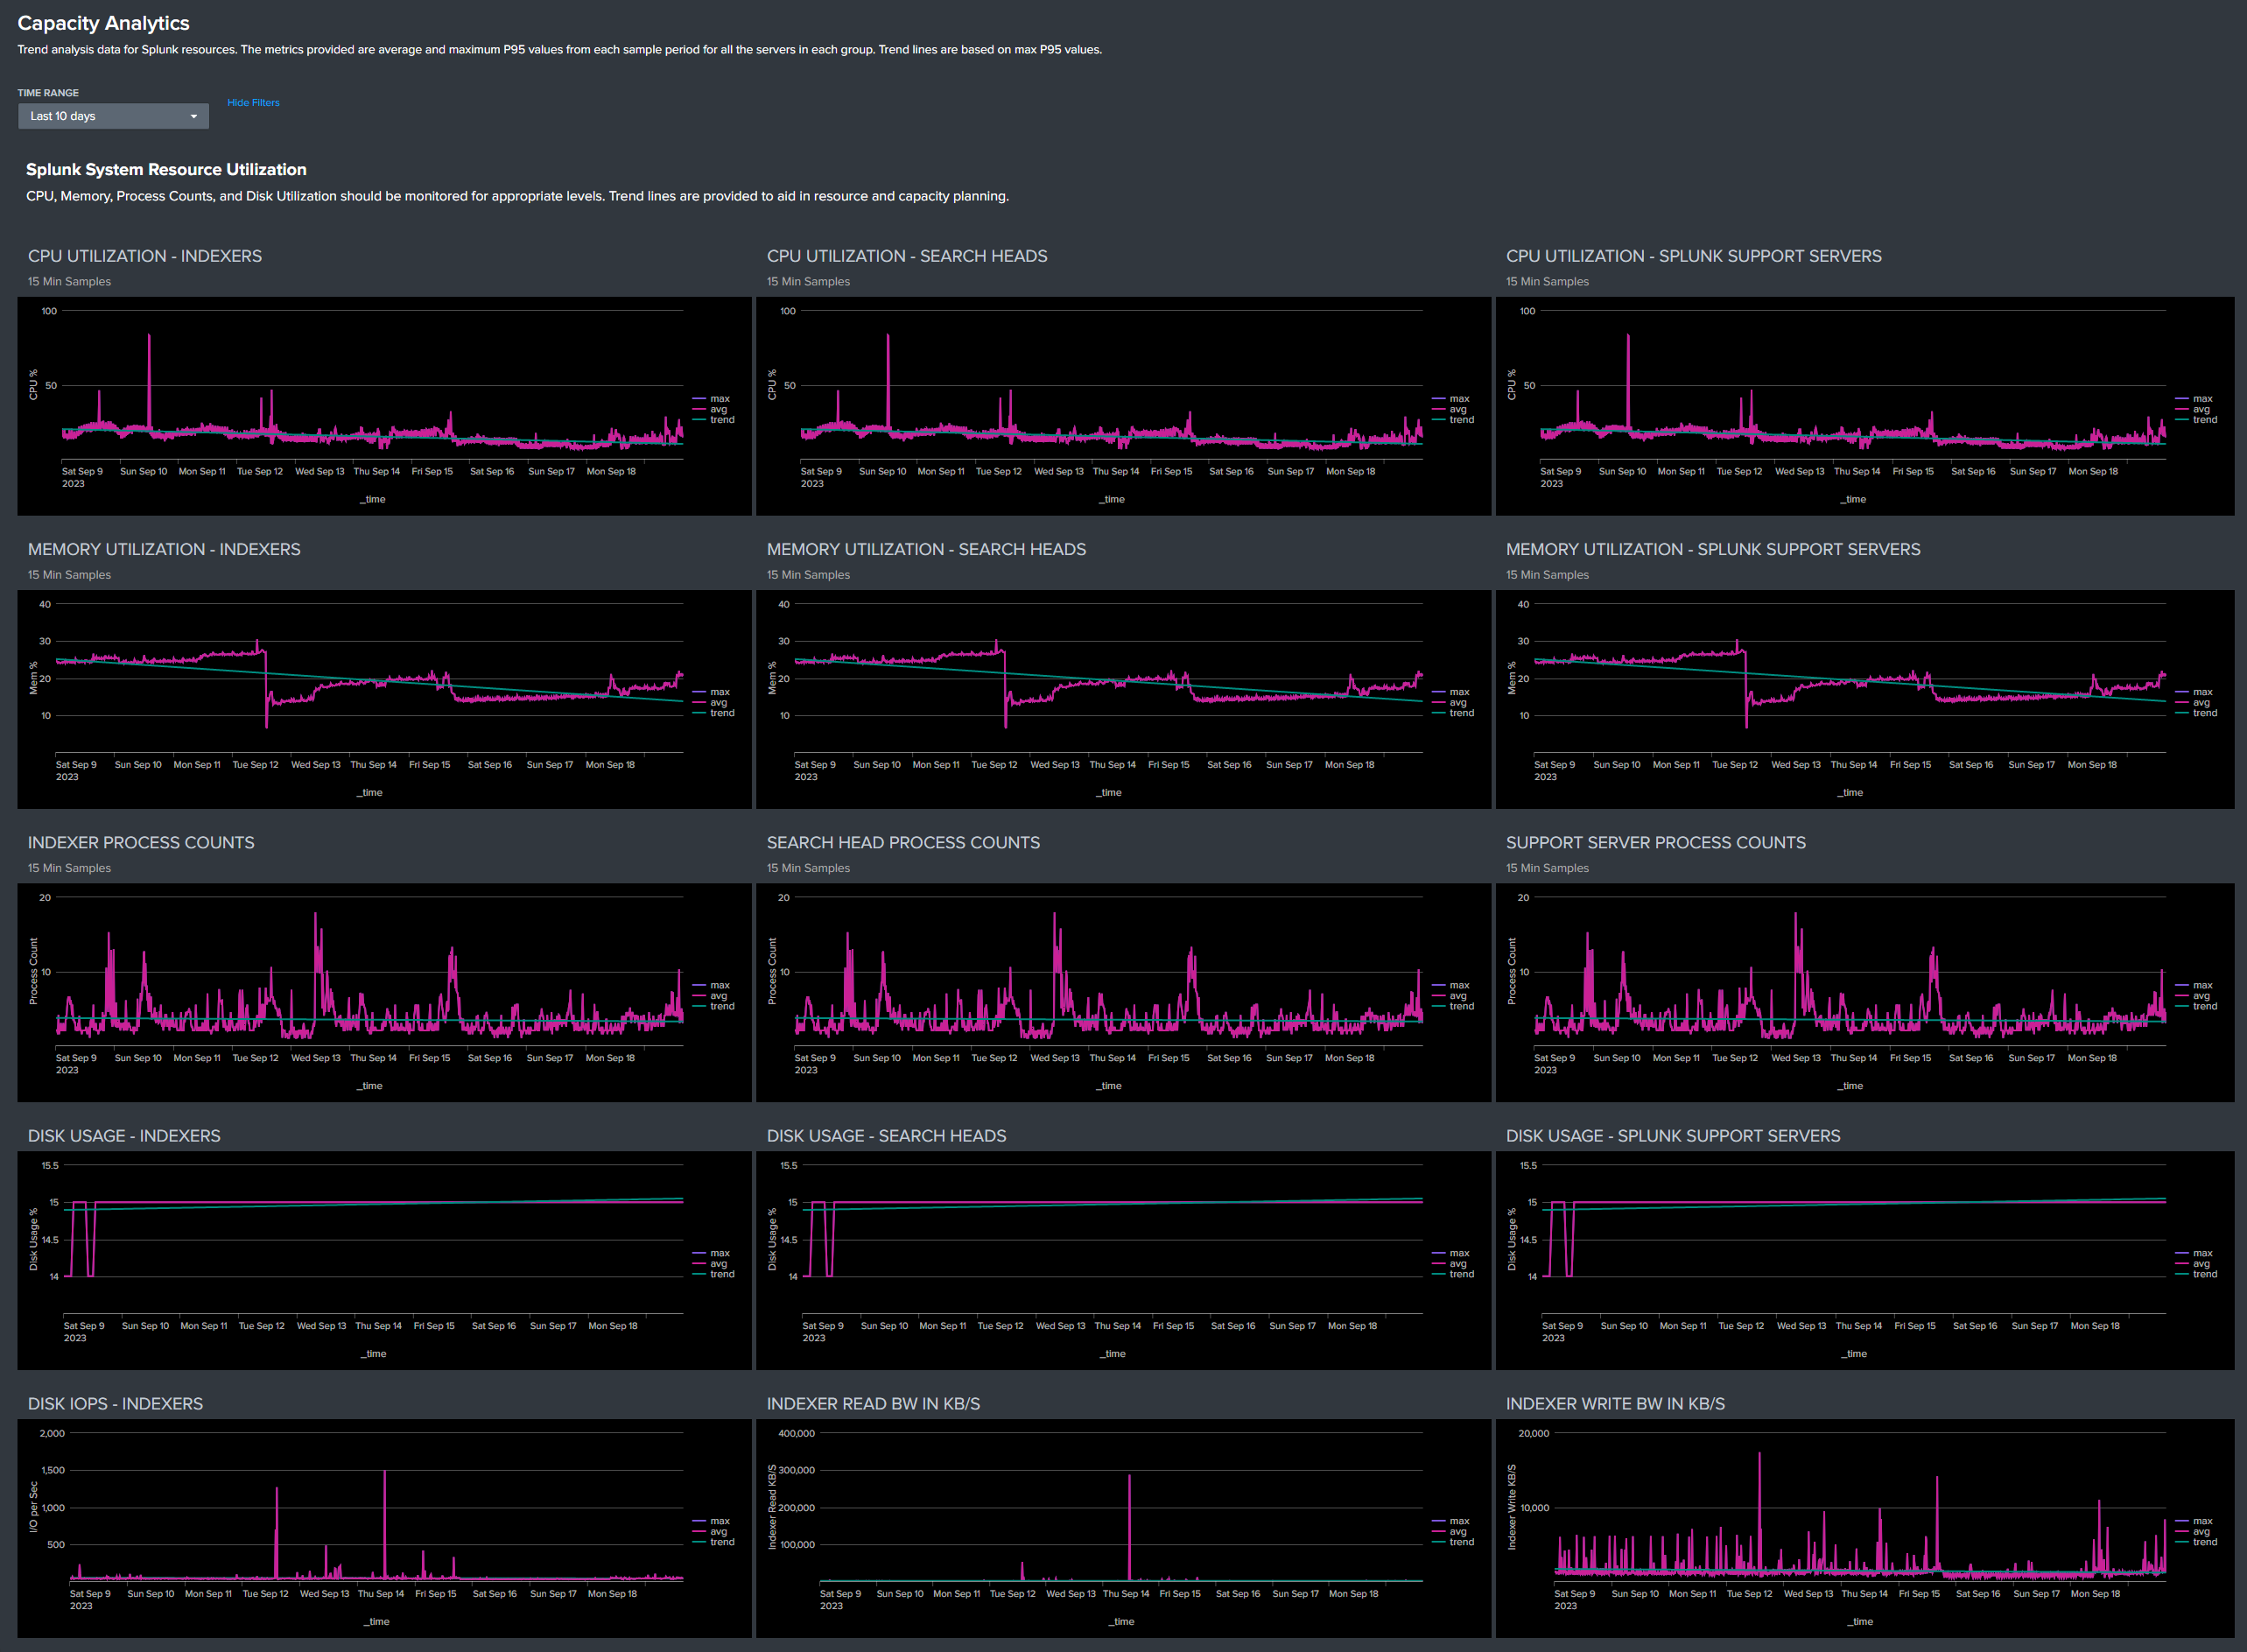
Capacity Analytics Dashboard
This dashboard provides trend analysis for Splunk resources, useful for troubleshooting and long-term planning. After collecting sufficient historical data (90+ days), these trends can help project future resource and license requirements.
The metrics shown are primarily average and maximum 95th percentile values from 15-minute sample periods, summarized across server groups. Significant deviations from normal patterns should be investigated using the System Resources dashboard.
This data helps establish "normal" baselines and trends for your environment, essential for maintaining stability.
System Resource Utilization
Monitor CPU, Memory, Process Counts, and Disk Utilization with trend lines for capacity planning. Unusual IOPS and bandwidth patterns warrant investigation.
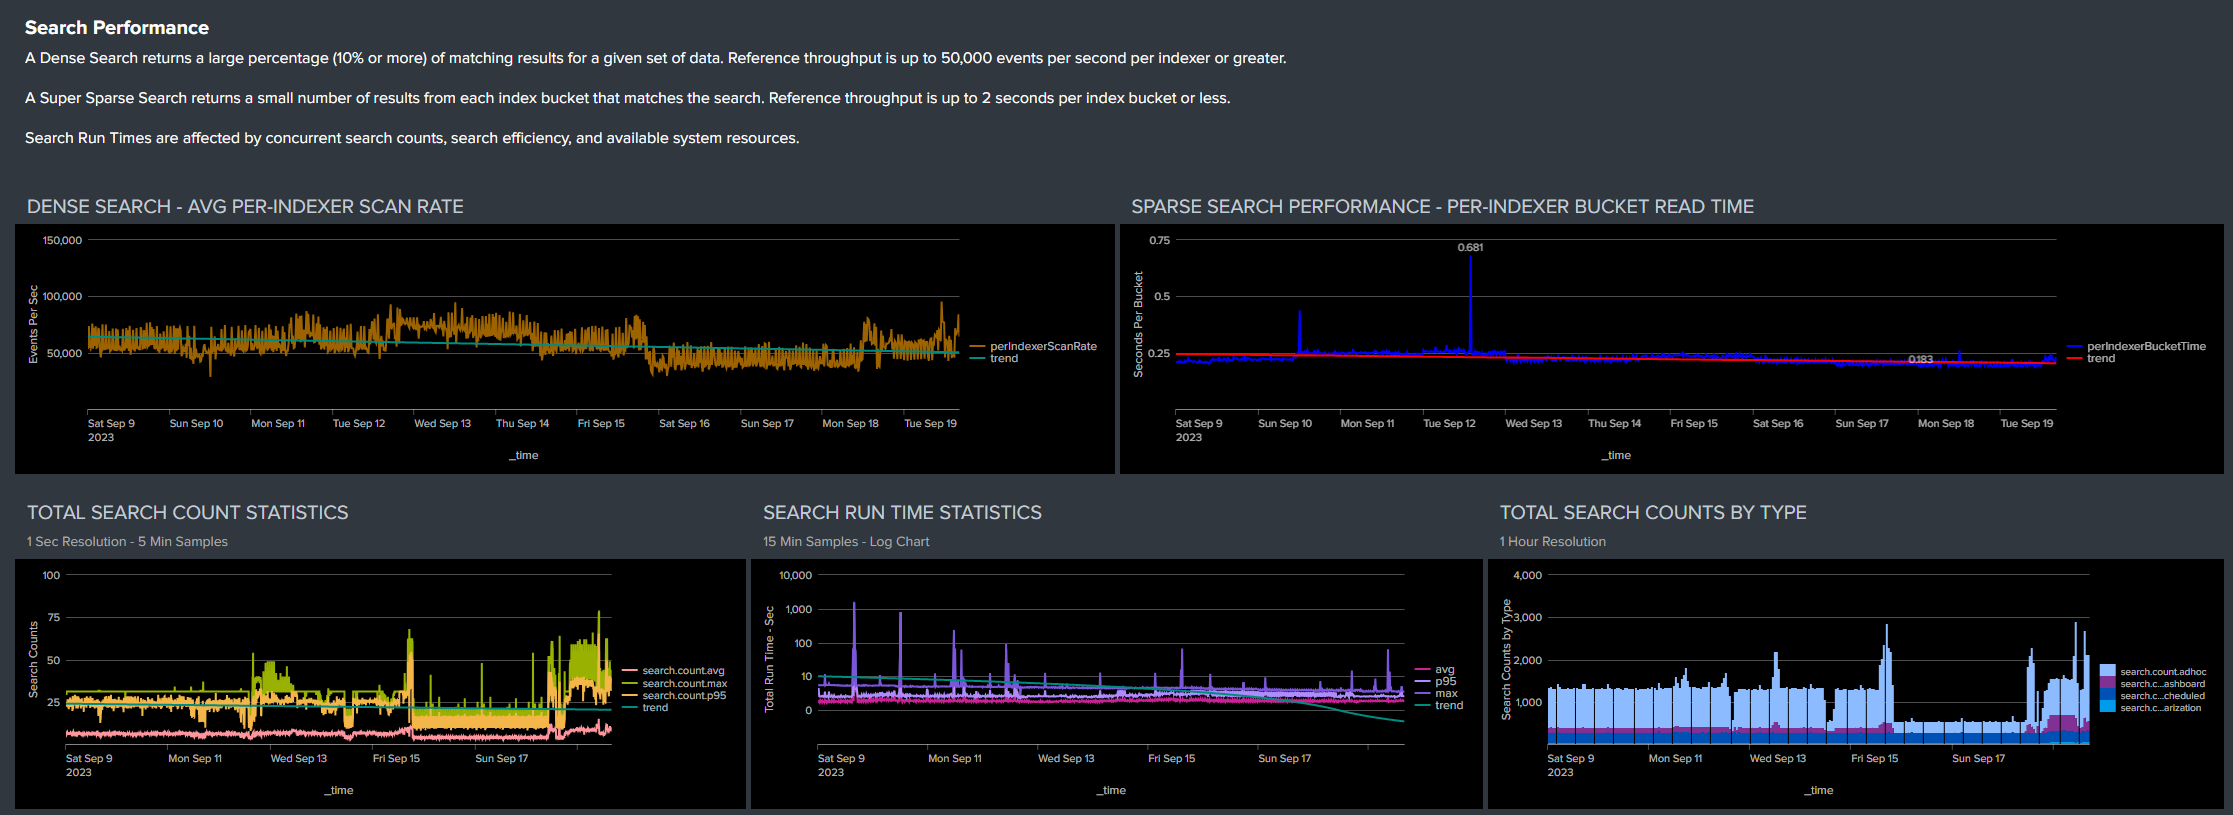
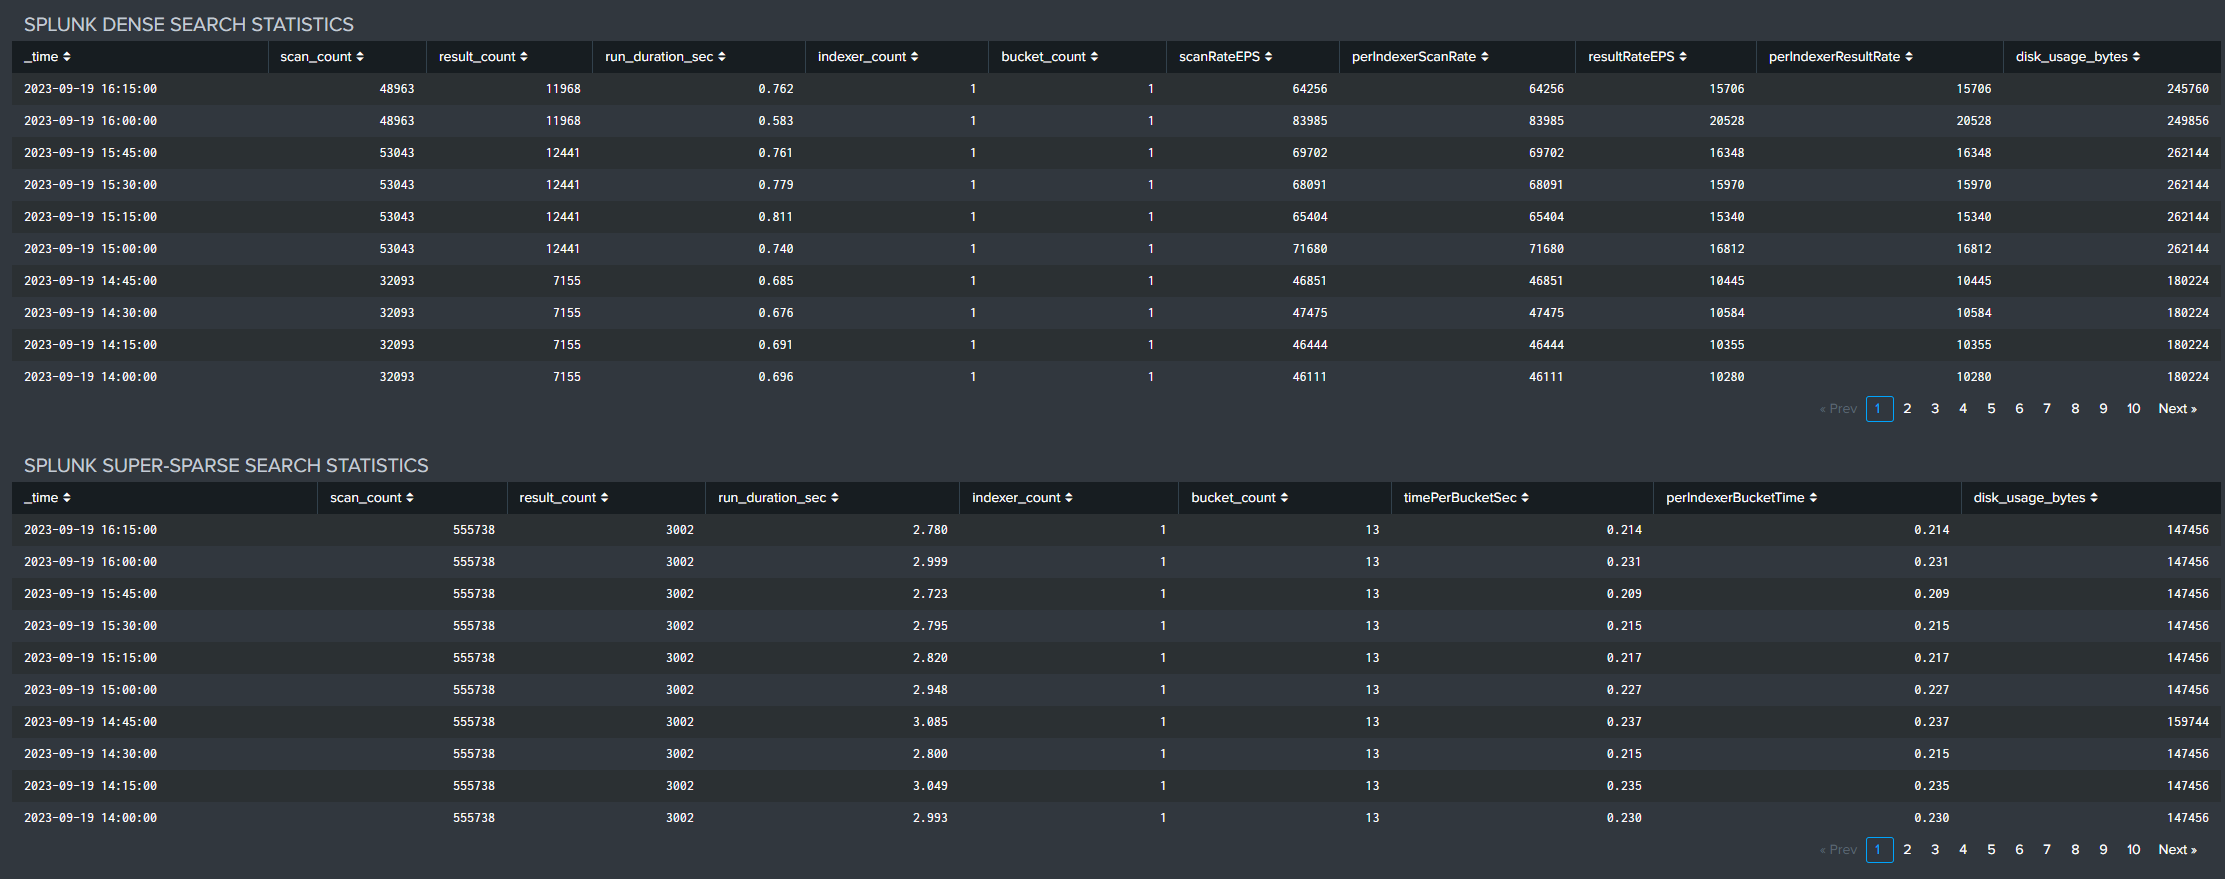
Search Performance
These metrics help monitor performance over time and correlate with environment changes.
- Dense Search: Returns 10%+ of matching results (reference: up to 50,000 events/second/indexer)
- Super Sparse Search: Returns few results per index bucket (reference: up to 2 seconds per bucket/indexer)
Statistics include 5-minute average, maximum, and 95th percentile counts based on 1-second samples, showing both peak and normal loading.
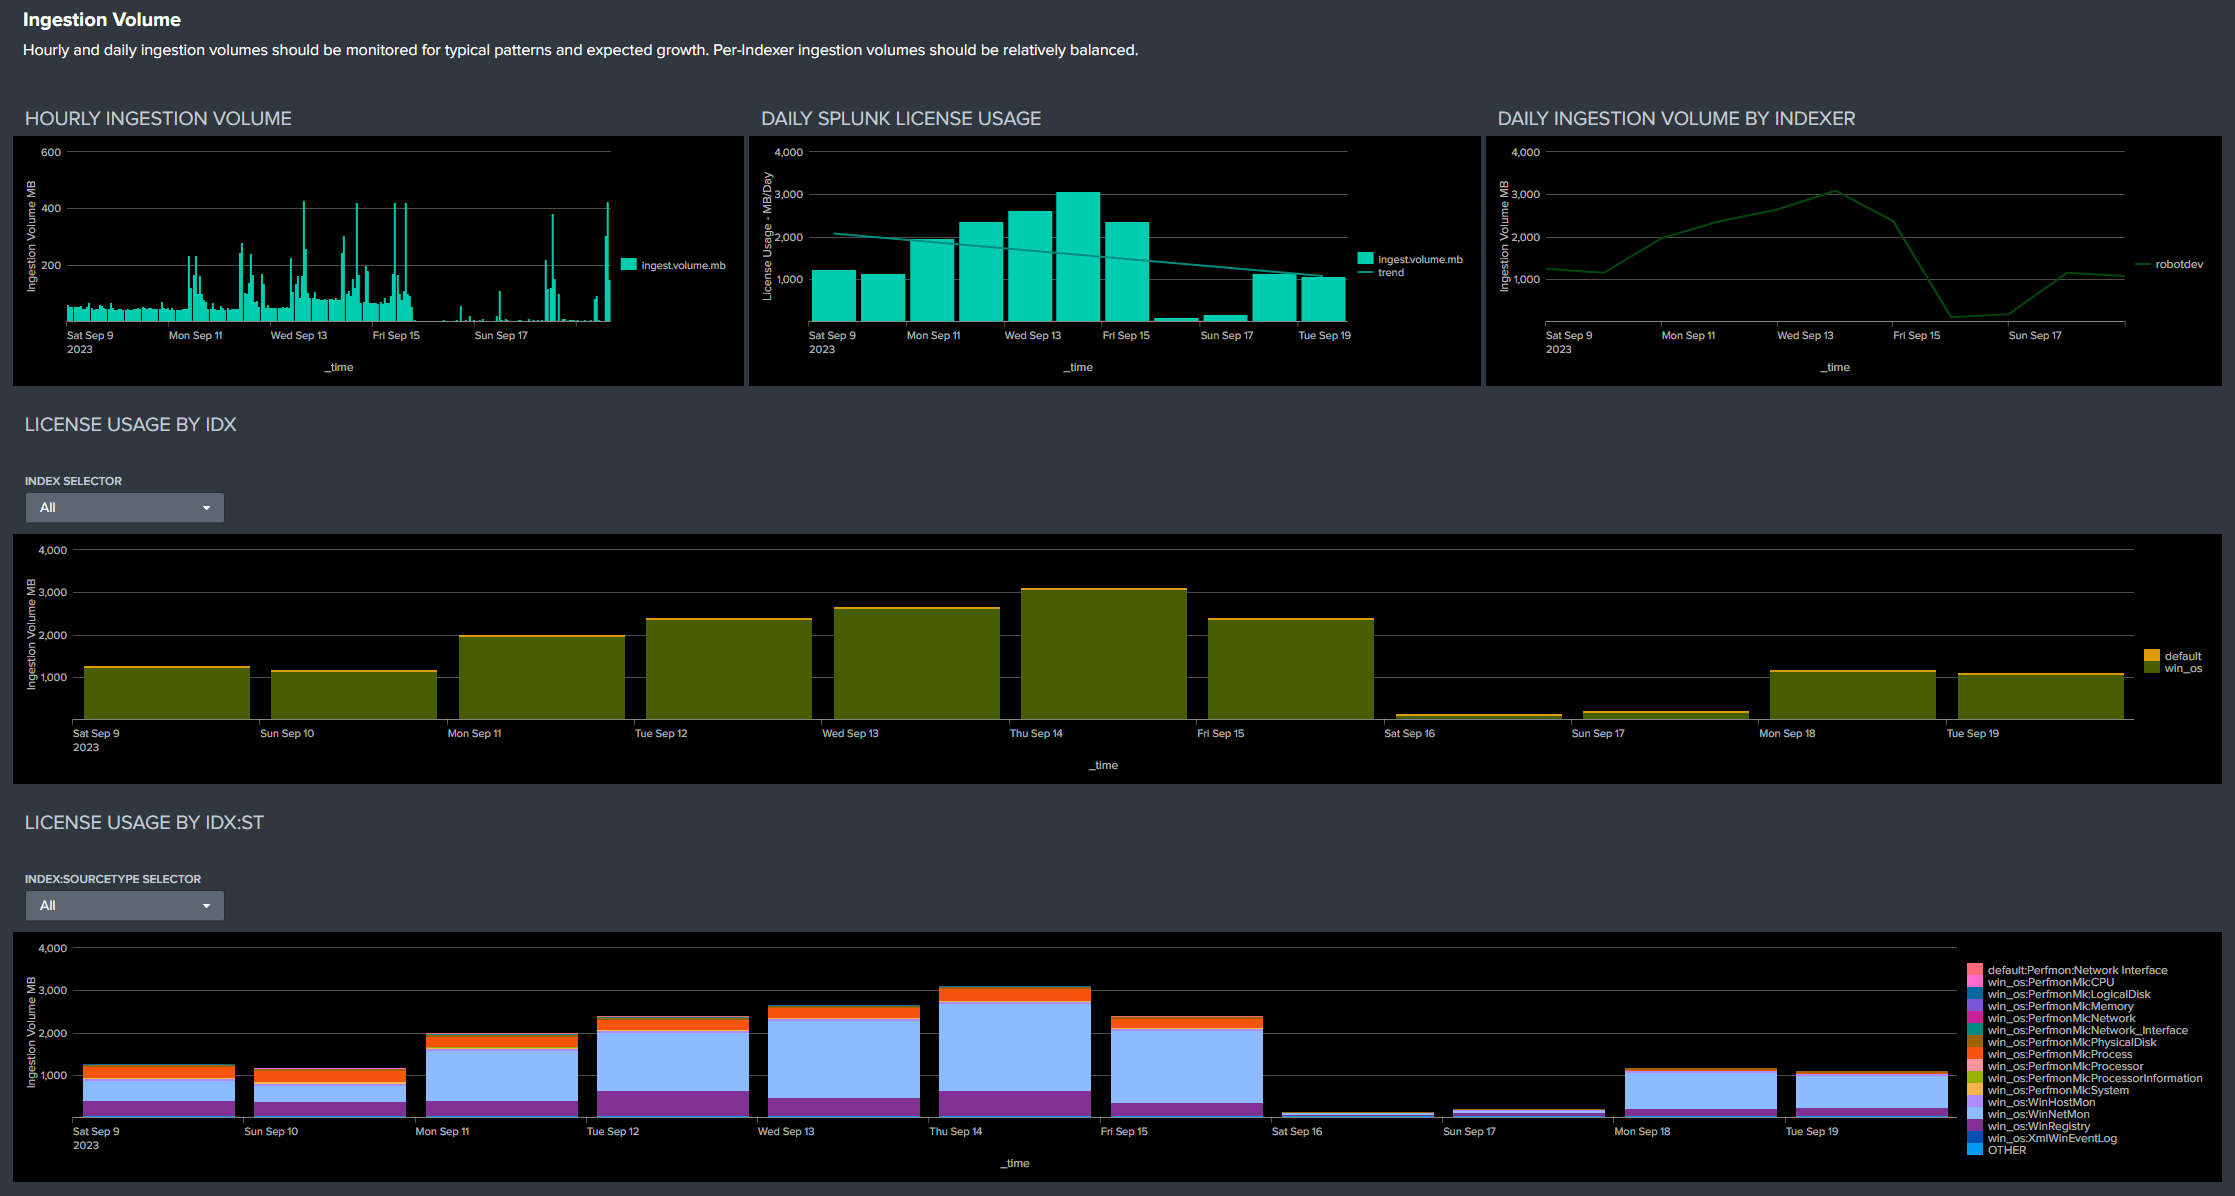
Ingestion Volume
Monitor hourly and daily ingestion for patterns and growth. Check per-indexer volumes for balance and license usage by index/sourcetype for unexpected changes.
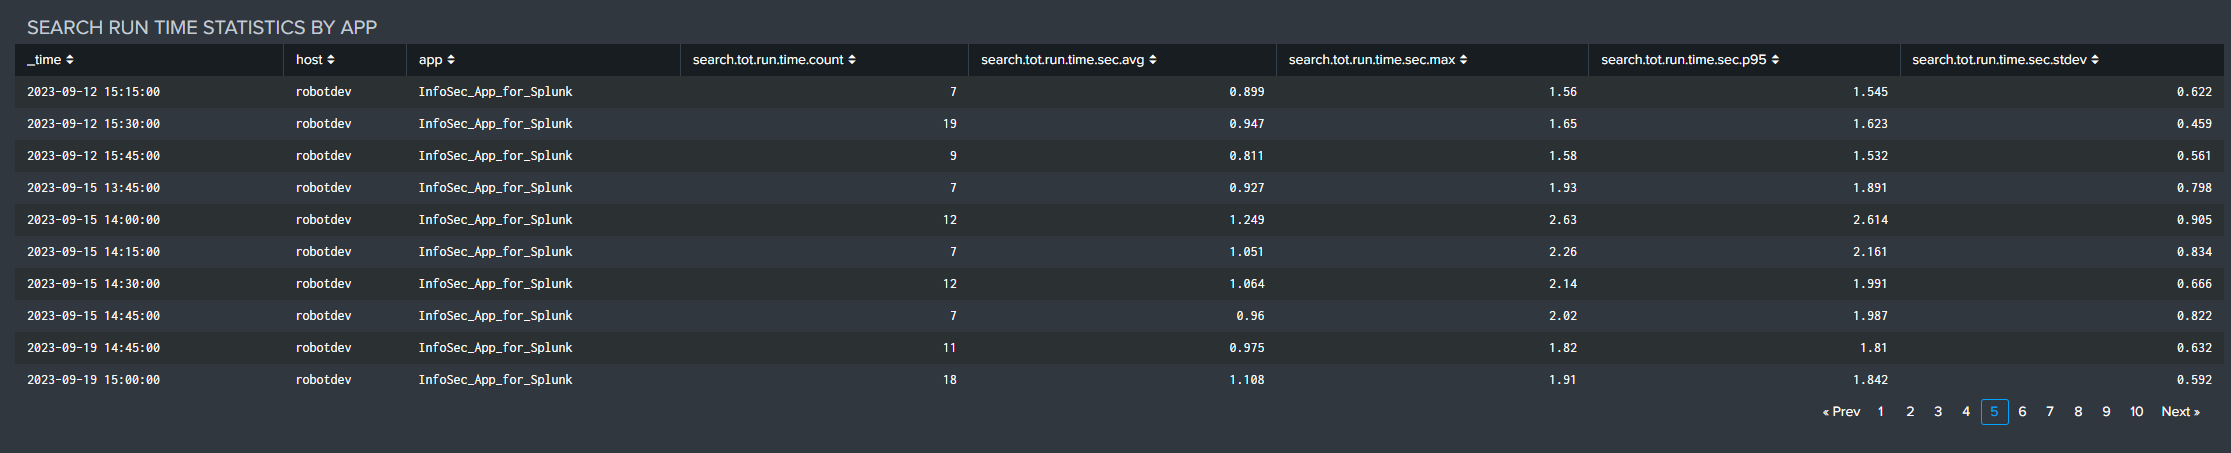
Tabular Data
Export license usage data for statistical analysis, capacity planning, and chargeback activities.
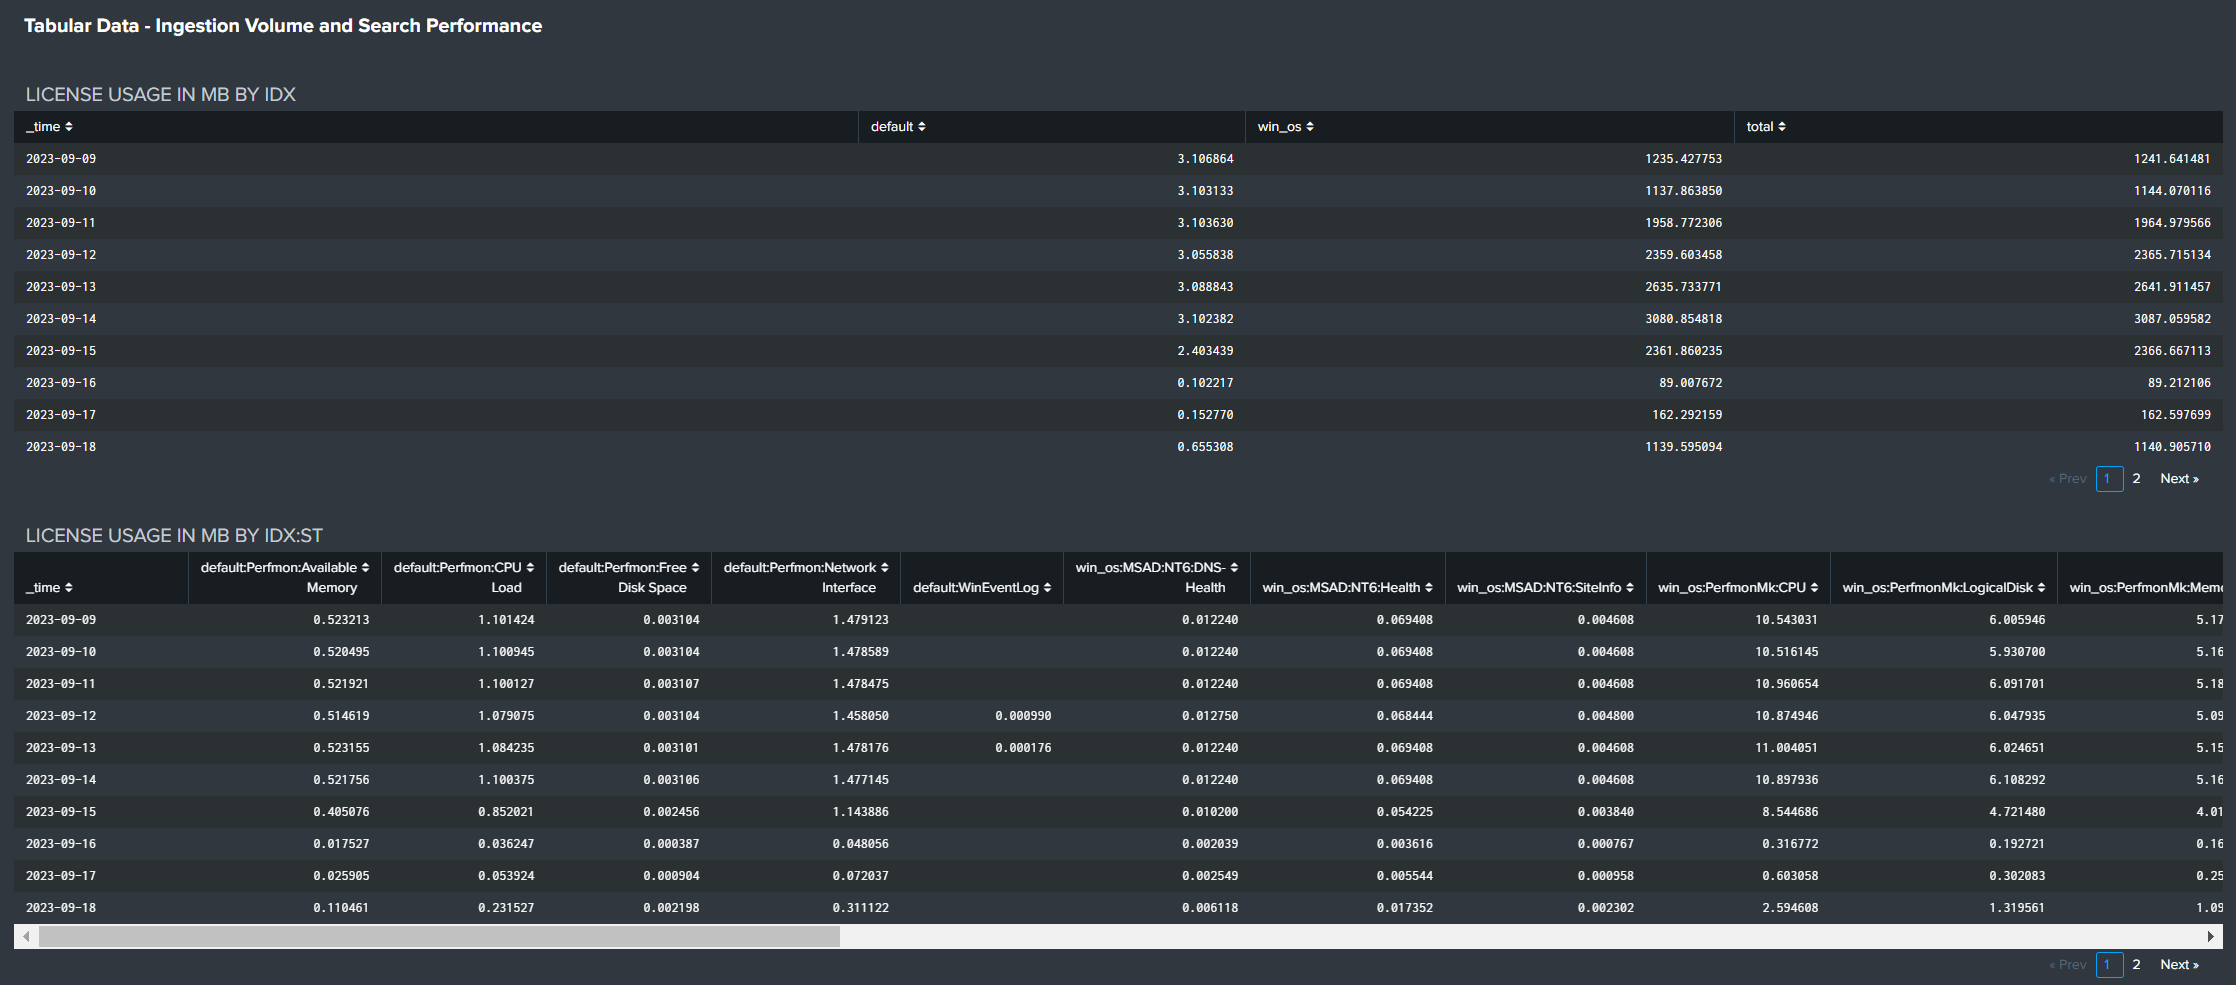
Review and export search statistics for detailed analysis.
Examine search run time statistics by app over time for performance analysis.