Using Monitor

Monitor
Atlas Monitor provides you with unparalleled visibility and alerting into your Splunk environment's data ingests. Dashboards, Alerts, and Enterprise Security all rely on a constant and reliable feed of data flowing into the Splunk environment. Without pro-active measures, however, these data streams can fail, causing inaccurate reporting and cascading failures. Splunk admins can utilize Atlas's simple interface to create Monitors, which will track and alert on data ingest failures, preventing errors and increasing reliability. Monitors efficiently utilize Splunk resources to do more with less, while providing highly detailed reporting without added complexity. Within Atlas Monitor, admins are able to group together Monitors to consolidate reporting, and can leverage lookup tables and custom searches to leverage Change Management Knowledge Objects. With Atlas Monitor, admins have a powerful tool that will increase data flow stability and awareness.
Will this impact my Splunk environment?
Atlas utilizes advanced capabilities to reduce load on your environment and ensure its impact remains small.
Monitor Capabilities
-
At-a-glance summaries to enable admins to quickly assess data flow health with custom thresholding
-
Create, edit, and report Monitor Groups, allowing admins to group together related data flows for visualizations and reporting
-
Leverages metric indexes and enhanced searching to reduce resource utilization
-
Report on Outages to enable historical tracking of downtime
-
Automatically send alerts by email when Monitors breach thresholds
-
Integrate lookup tables for integrating CMDB and assets & identities files
-
Create custom searches to monitor unique data sets utilizing advanced base searches
Monitors Overview Dashboard
The Monitors Overview dashboard is a great way to get a birds-eye view of your environment's Data Watches. Each group's name, description, current health, and owner are shown in that group's tile. You can hide or show certain groups or extend or shorten the time range in question with the filtering options at the top of the page. This allows you to get the information you need quickly and efficiently.
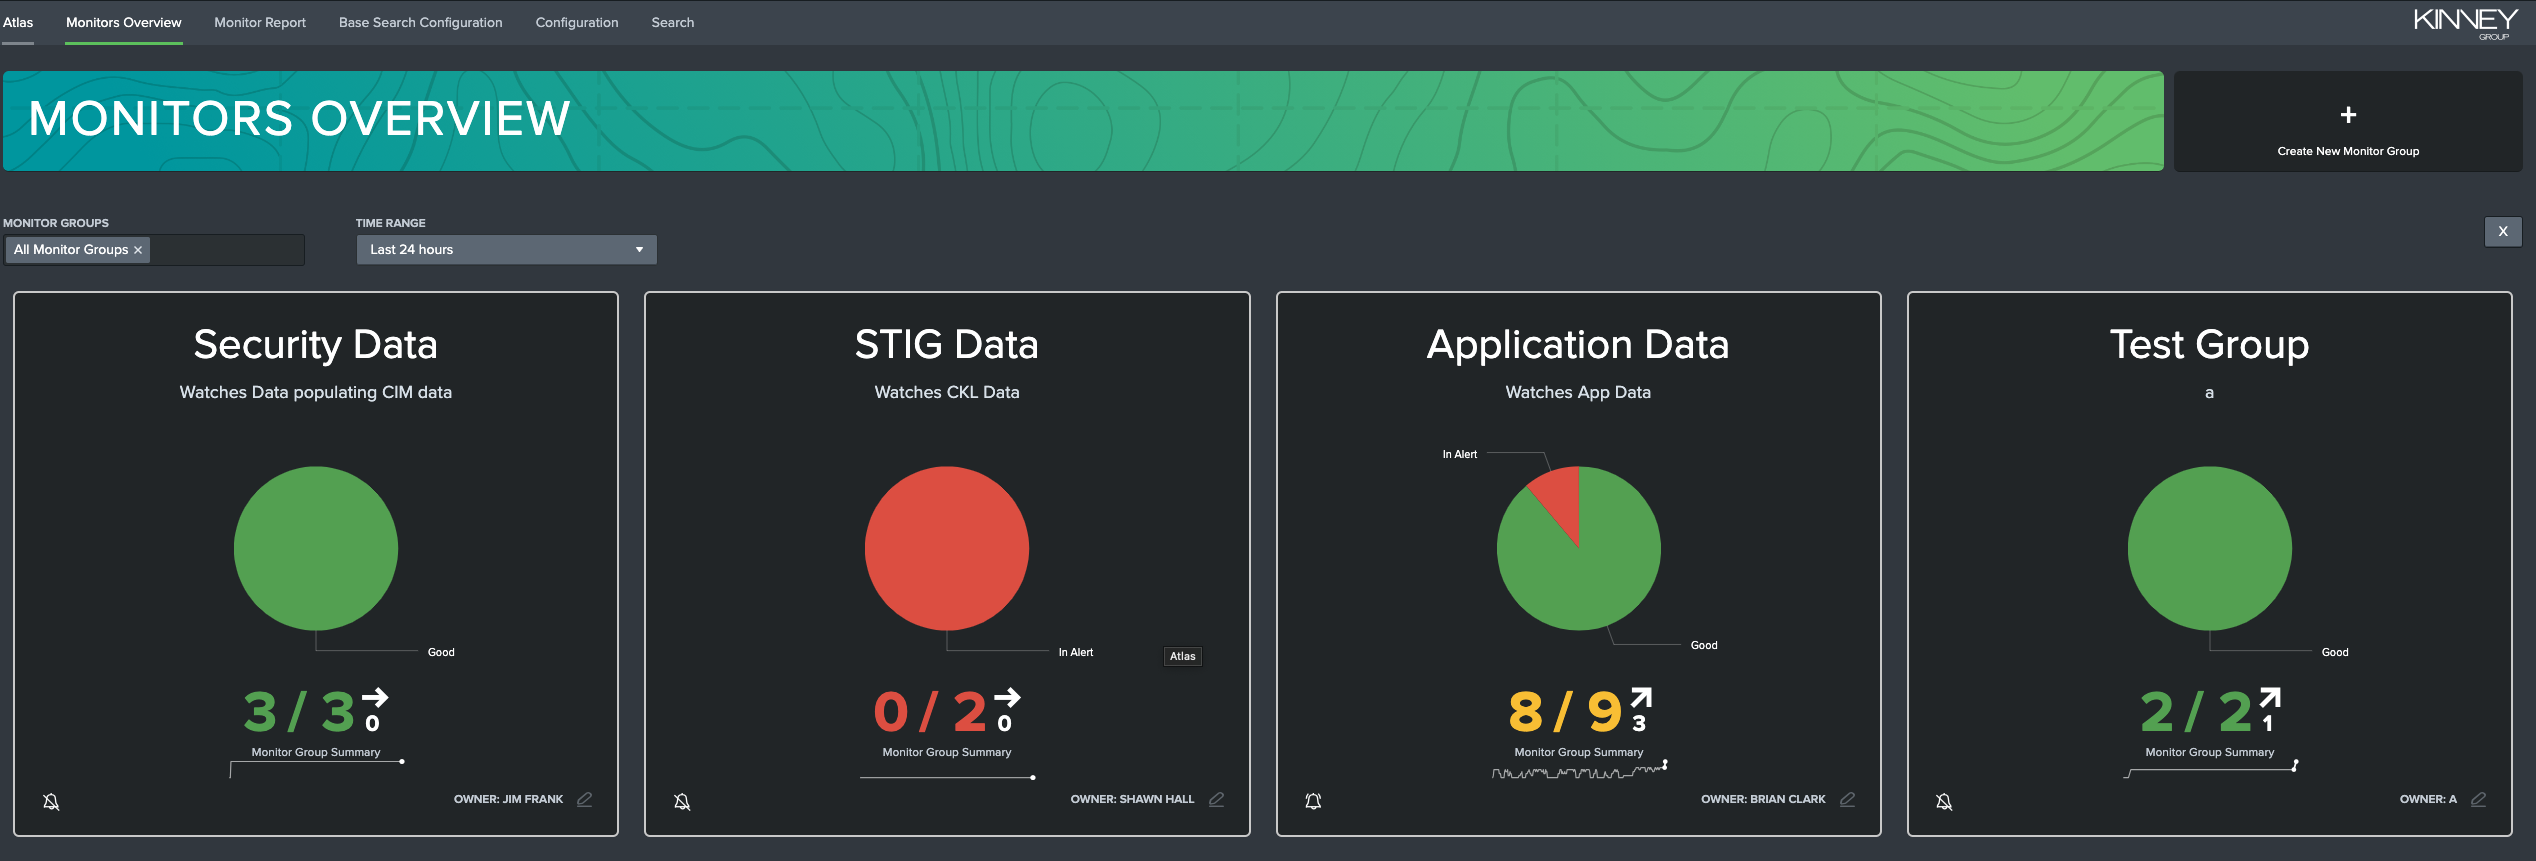
Clicking on any of these groups' tiles will open that group's report in the Monitor Report dashboard, which will be explained in the next section. You can, if you have the correct permissions, edit the group's information by clicking on the edit button in the lower-right corner of each tile.
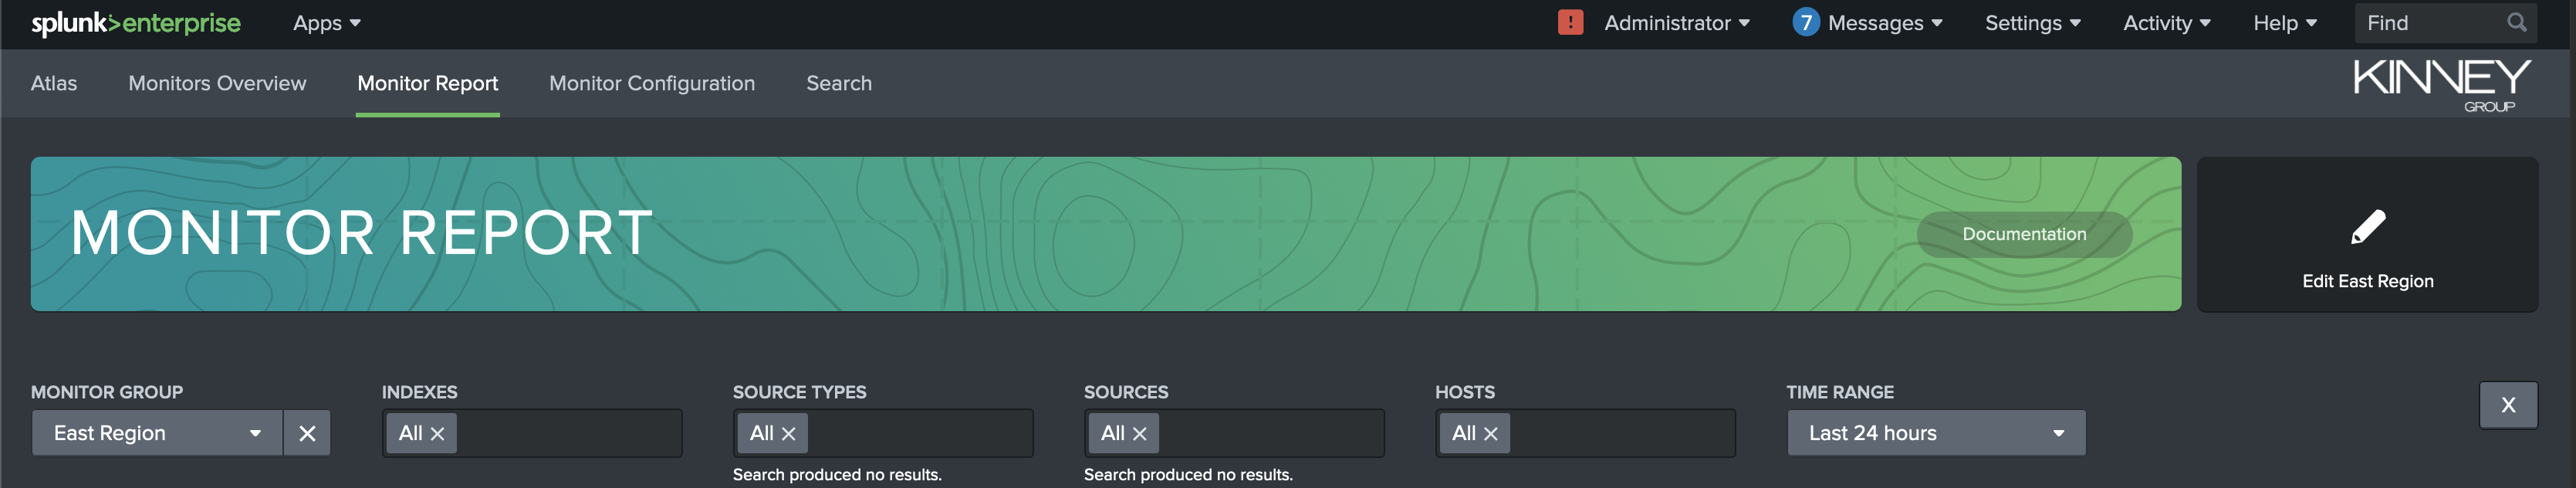
Monitor Report Dashboard
The Monitor Report dashboard allows you to view more detailed information about a single Monitor Group. The top of the tab contains filters to allow you to easily find and select the Monitor Group you're interested in. You can also select a time range that determines from when the results and alerts shown are gathered.
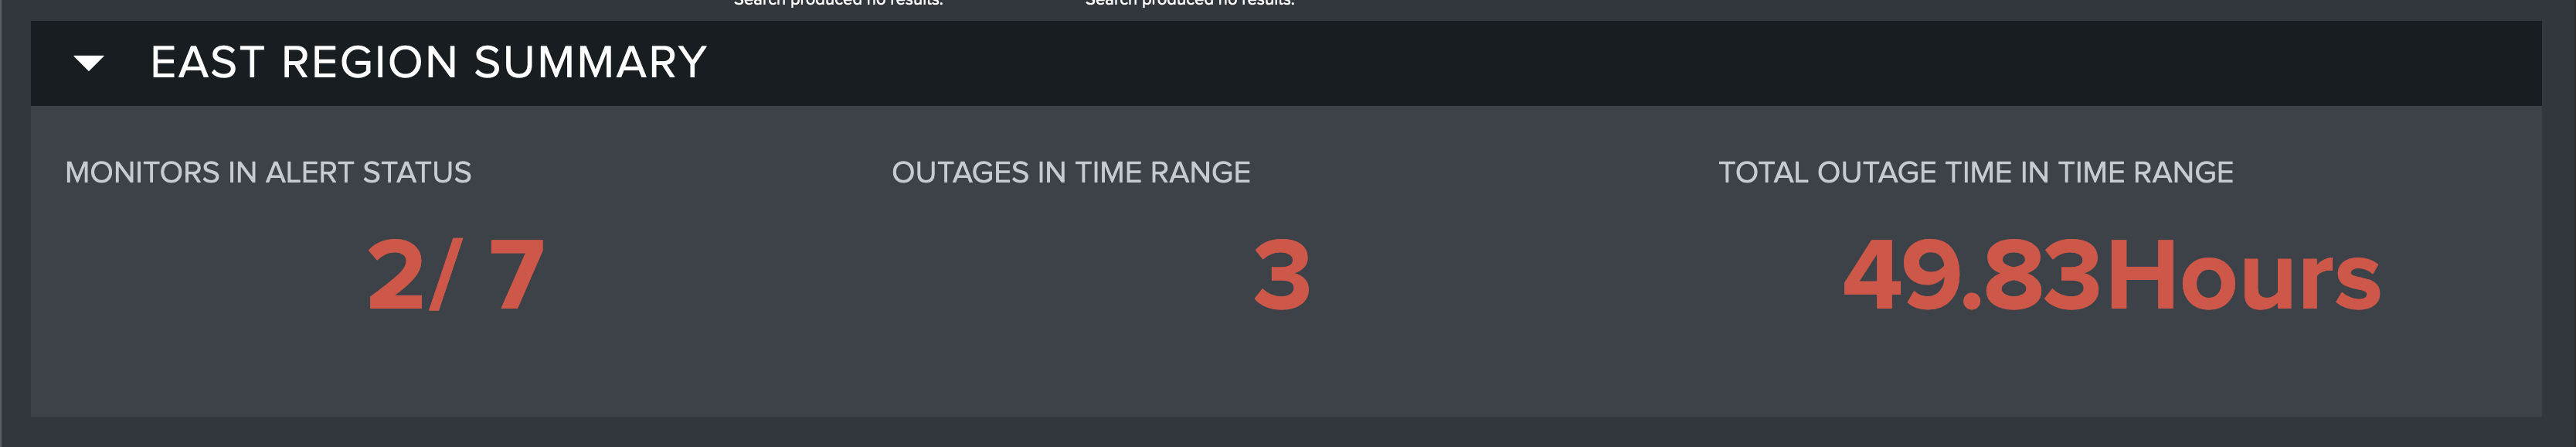
Monitor Group Summary
The first dashboard of Monitor Report shows high-level KPIs (Key Performance Indicators) for the selected Monitor Group. These KPIs are designed to give you an idea about the status of the Group at a quick glance. These indicate:
- The number of Monitors in Alert status
What does it mean for a Monitor to be 'In Alert'?
Monitors in Alert status have failed to reach their last event threshold
- The number of Outages in the Time Range you have selected
What is an 'Outage'?
An Outage is defined as the amount of time a Monitor was consecutively in an 'Alert' state
- The amount of time (in hours) in the chosen Time Range spent in an Outage
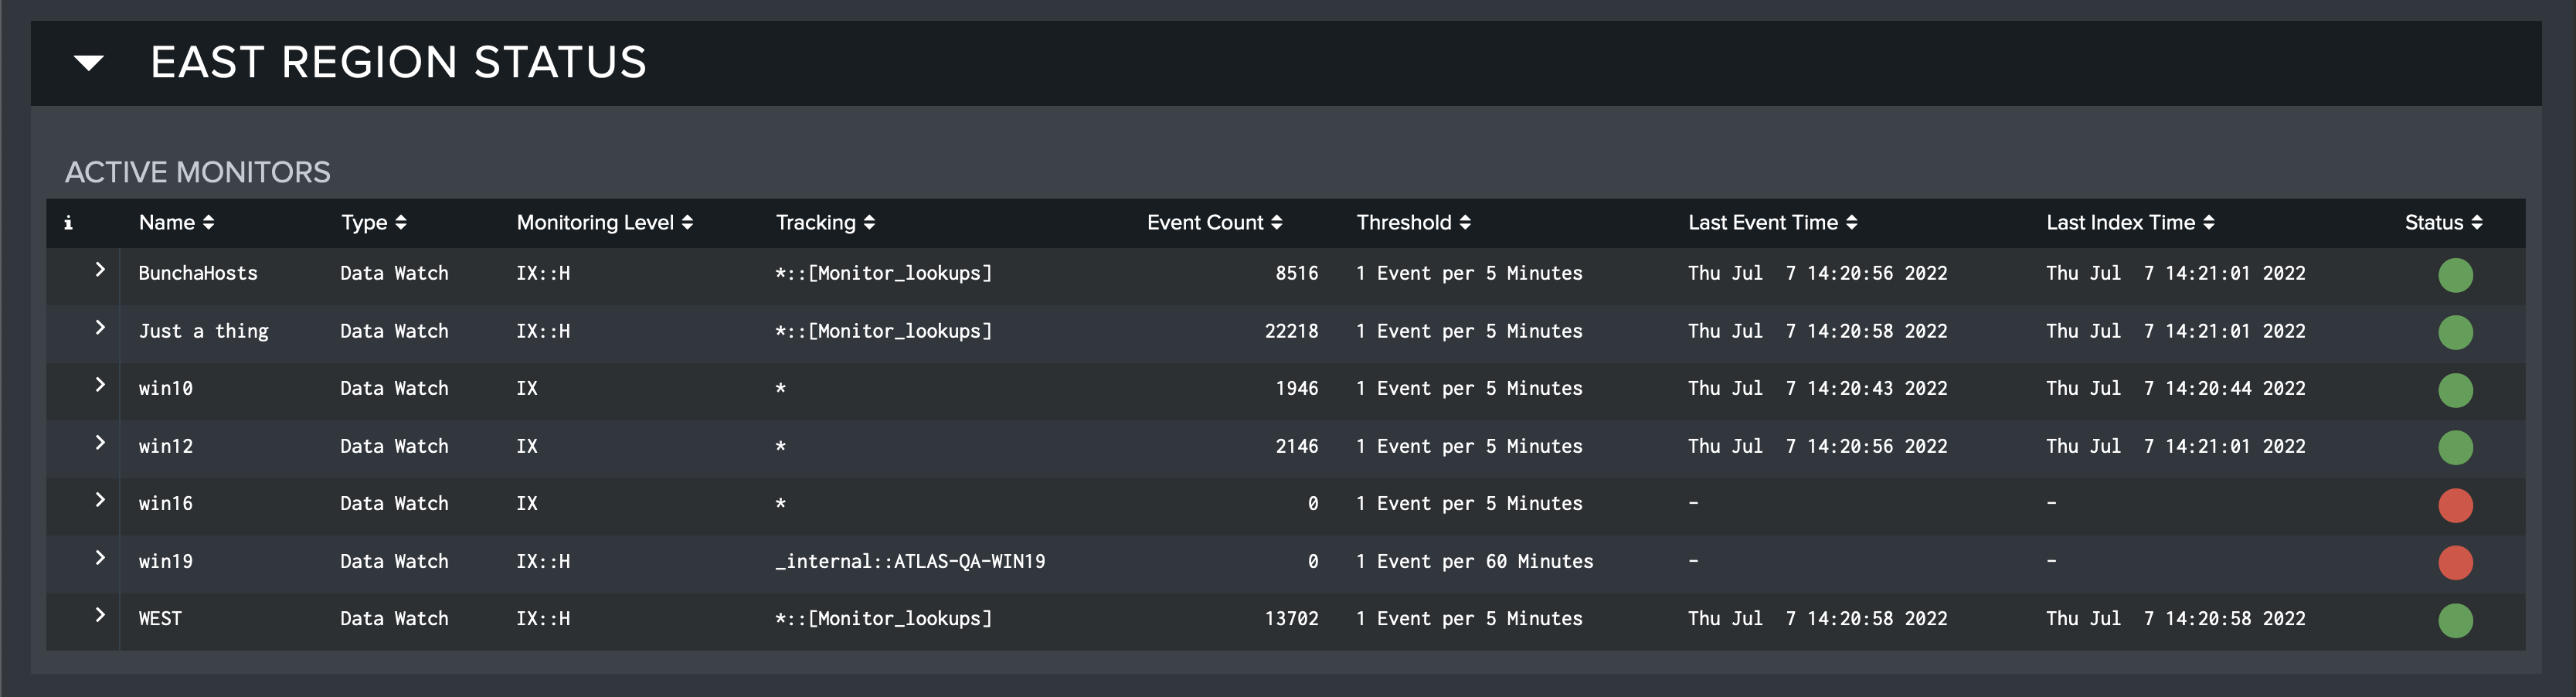
Monitor Group Status
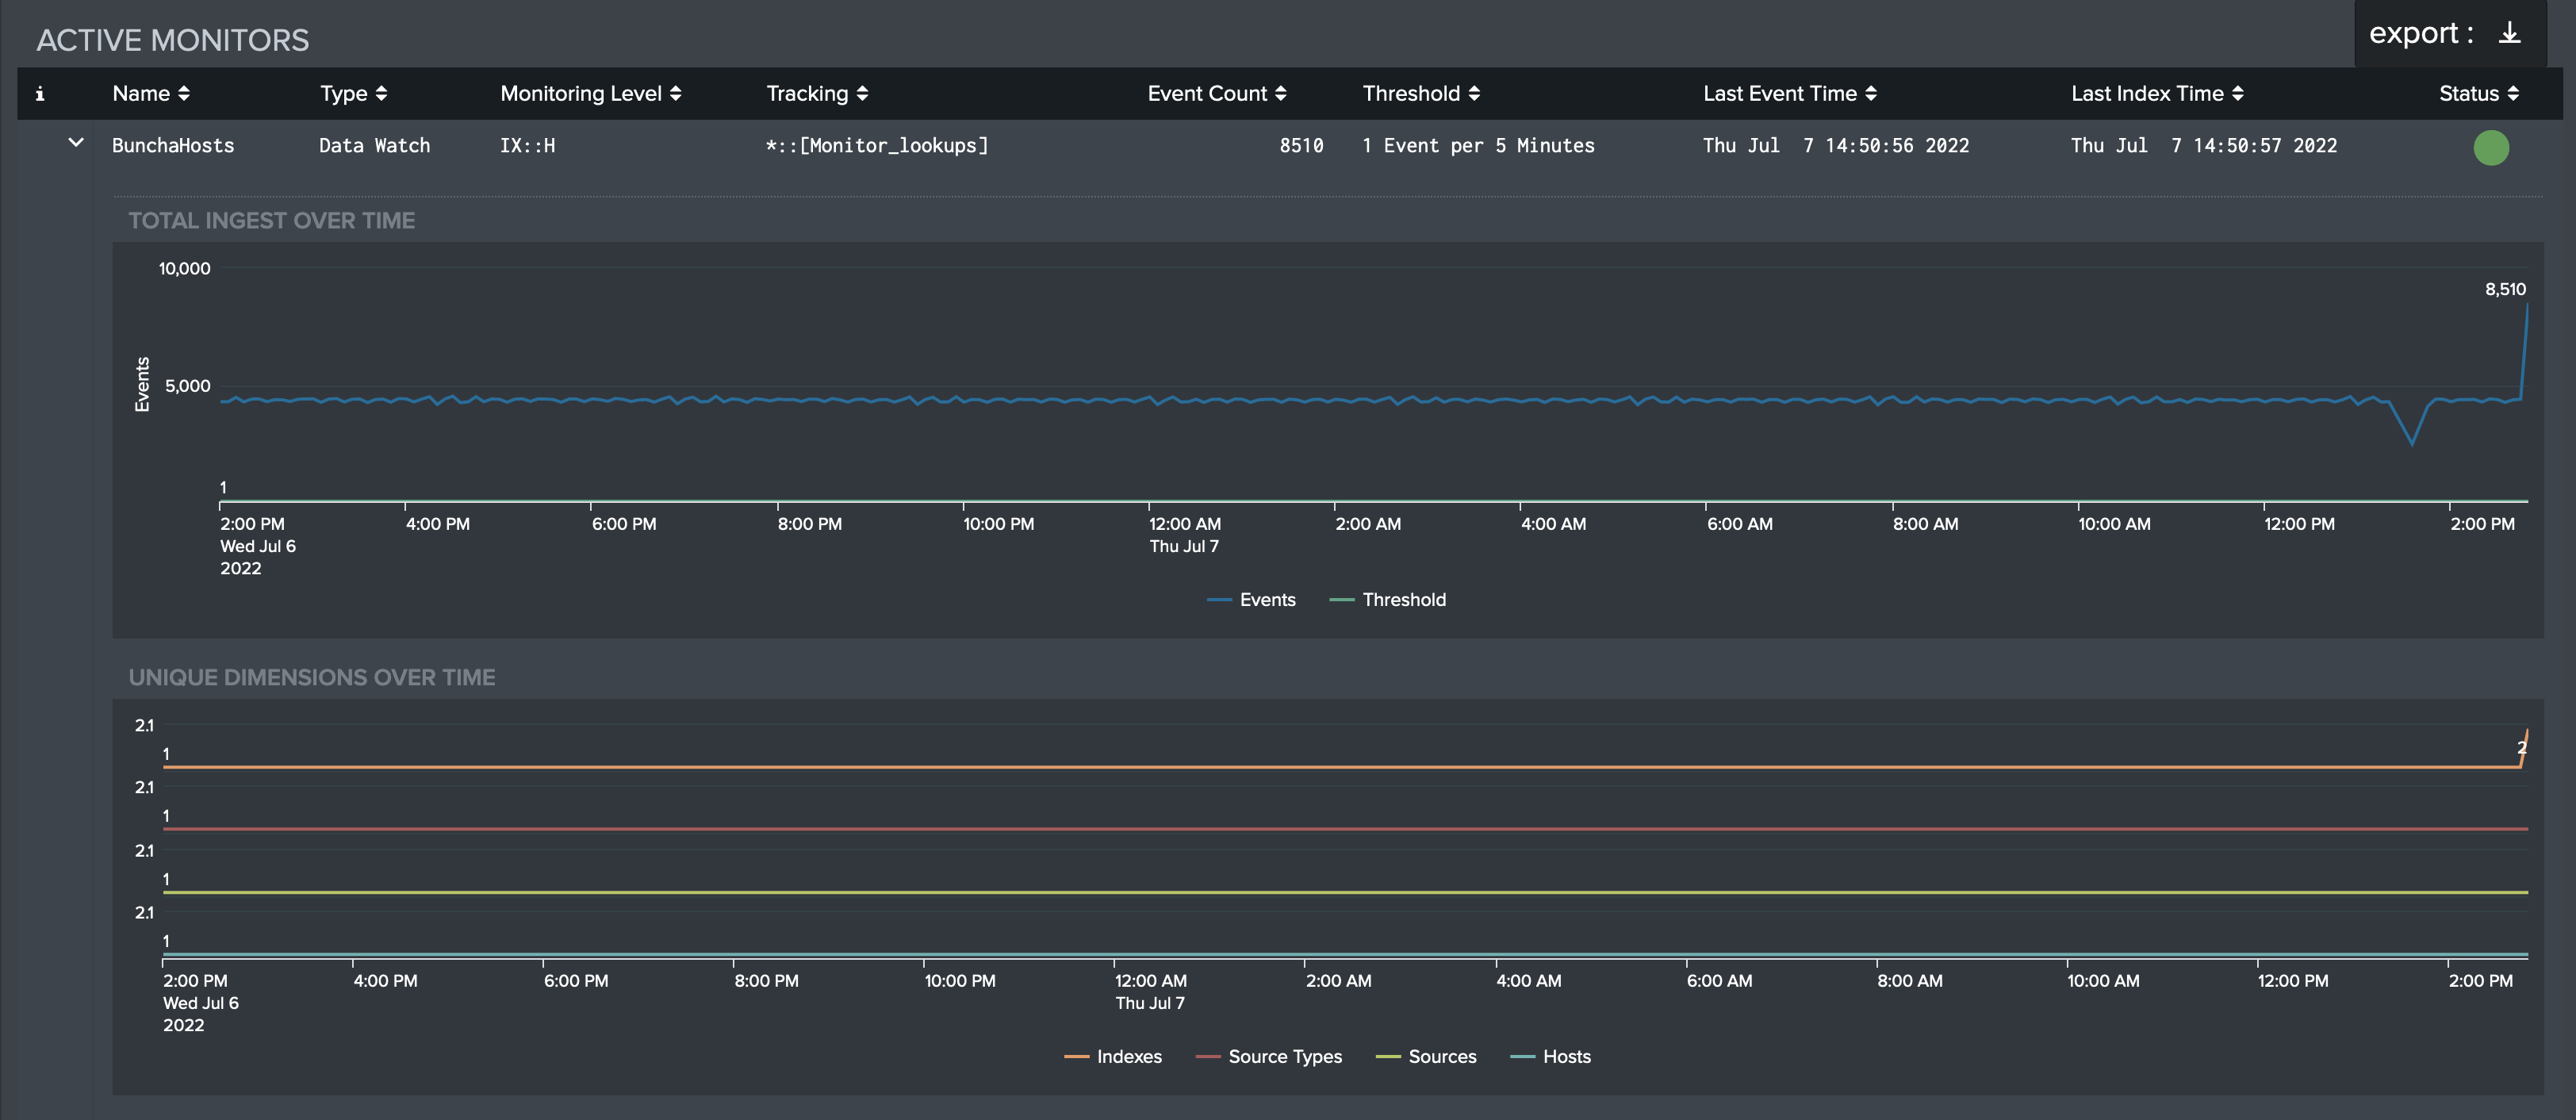
The second dashboard of Monitor Report is a more detailed, exportable report of each monitor in the selected group. This table gets more into the nitty-gritty of each Monitor, indicating:
-
The Monitor's name and type
-
What the Monitor is tracking
-
The number of events and the event threshold
-
When the last event occurred and when the Monitor was last indexed
-
The current status of the Monitor (healthy/unhealthy)
As mentioned above, this table can be exported. This can be done by hovering over the table and clicking the button that appears in the top-right corner. The 'Export Results' modal appears and the format (CSV, XML, or JSON), name, and desired number of results can be chosen. Each entry in the table can also be clicked to drill down and expose charts of the Total Ingest used by the Monitor over the Time Range specified and the number of Unique Dimensions over the Time Range specified.
Monitor Group Outages
The third and final dashboard of Monitor Report contains a table similar to the table in Monitor Group Status. This table contains that information which pertains to Outages. In addition to the fields shown in Monitor Group Status, this table includes:
-
When the Outage started and ended
-
The estimated duration of the Outage
-
The average percentage of the event threshold reached
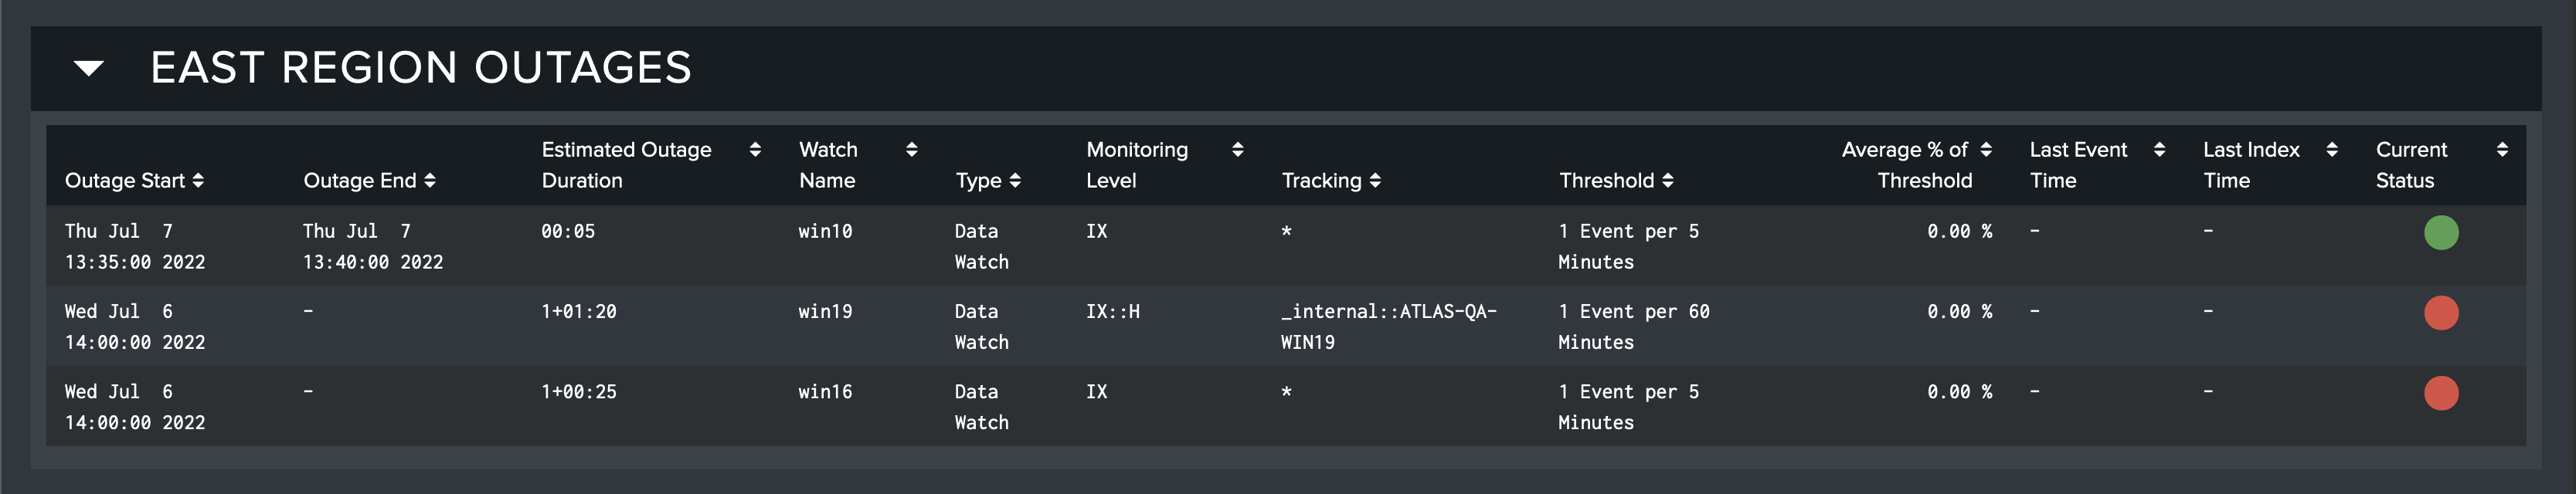
This table can also be exported in a similar manner to the Monitor Group Status table.
Creating a Monitor Group
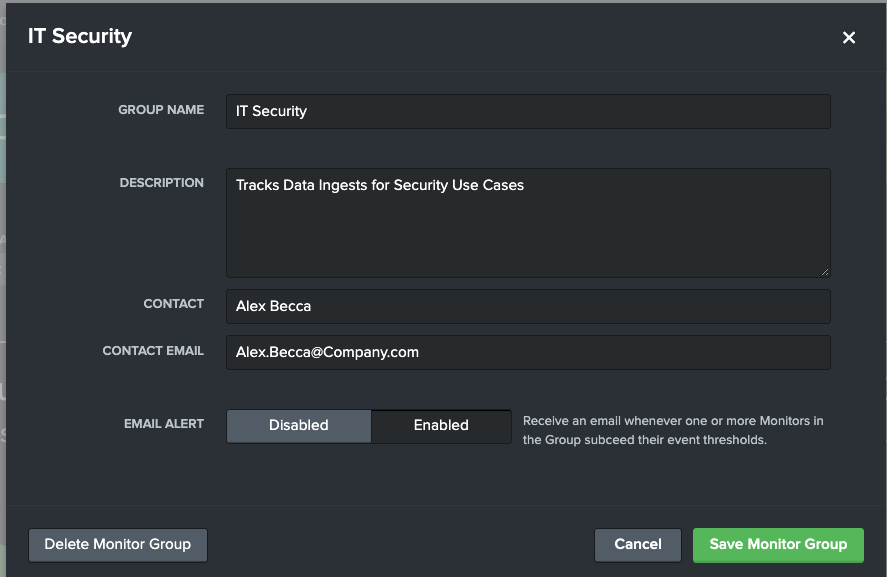
Monitor Groups are used to organize and collect Data Watches in a way that reflects how Splunk is used and managed. Atlas Admins can create Monitor Groups by selecting the Create Monitor Group button on the Monitors Overview dashboard. This will open up a modal that enables the user to enter a name, description, and owner.
After created, Atlas Creators or Admins can create Data Watches, or set Monitor Group alert settings. Simply click either the edit icon on the bottom right of the Monitor Group tile, or the alarm icon on the bottom left to open their respective modal.
Monitor Alert Settings
Each Monitor Group has its own alert settings that are shared across the Data Watches. If the alert is enabled through the modal, then outages will create an email that is sent to the contact information provided. These alerts will happen once for each increment of the Data Watches. For instance, a Data Watch with a threshold of 5k events a day would only report an outage at most once a day. A Data Watch with a threshold of 100 events every 5 minutes has the potential of alerting every 5 minutes!
There are additional alert settings that can be customized for each group that give further control:
- Throttle: Enabling Throttle will provide the option to silence all alerts of outages for a set time after an initial outage is alerted upon. This would change default behavior of the Monitor alert to potentially reduce emails.
- Alerting Window: The Alerting Window empowers users to set what times the alert is active. It comes with default 'Anytime' and 'Weekdays', but also provides a custom time date range. This is useful to avoid alerting on weekend drops in data. This uses the Splunk system clock as a reference, so ensure that your times line up with your Splunk's settings to produce expected results.
Creating a Data Watch
Data Watches are a type of Monitor that Admins can create. They quickly and easily start tracking, alerting, and visualizing the health of data ingests being indexed in Splunk. This can empower Splunk admins to quickly find and triage issues in their environment and ensure accurate reporting.
Create a Data Watch
Identify an appropriate Monitor Group and open the edit modal.
Next, select the Add Data Watch button on the modal. This will open up the Data Watch Modal.
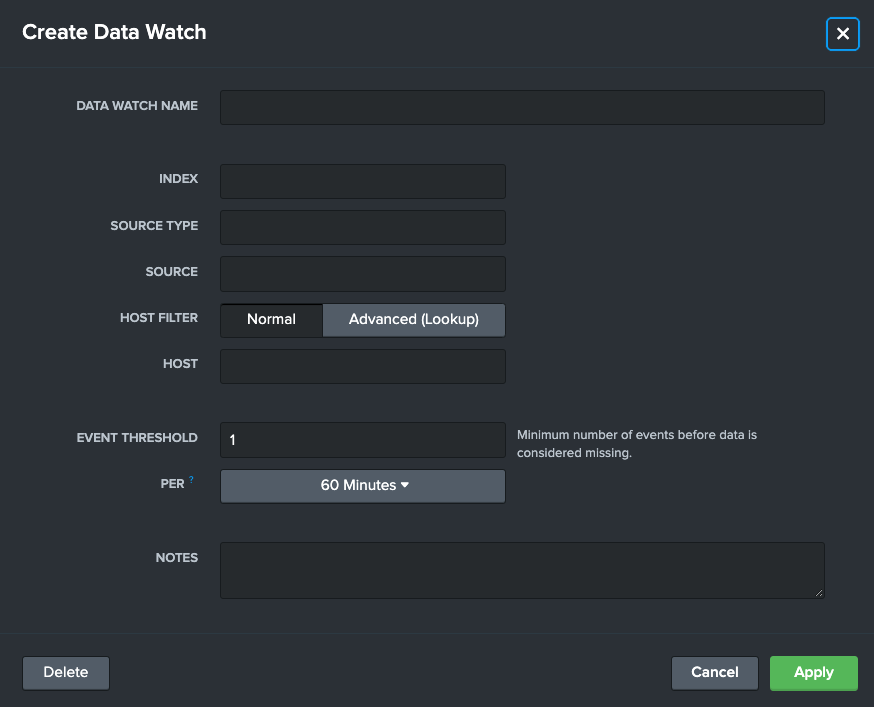
Use the details below to fill out the form:
-
Data Watch Name (Required): A readable name that describes the data being watched such as "Windows Logs", "Palo Alto Firewall Data", or "Log In info"
-
Index (Required): A Splunk index that is being monitored
-
Source Type: An optional input to narrow down the monitor to a source type level
-
Source: An optional input to narrow down the monitor to an individual source level
-
Host Filter: An option that enables advanced integrations with Splunk Lookups, see Integrating a Lookup with a Data Watch
-
Host: An optional input to narrow down the monitor to an individual host level
-
Event Threshold (Required): An amount of events that if this Data Watch falls below (in the "Per" time range) will mark it as "In Alert" and the start of an "Outage"
Setting the Event Threshold to "1" will mark the data ingest as healthy, unless no data is found
-
Per: A time range that the Event Threshold is held to, such as "500 events every hour"
-
Notes: A text box to record additional notes as needed
After filling out the required fields and any additional fields to meet the use case, select "Apply" to enact the Data Watch. This will start the monitoring process.
Data Watches will take the amount of time identified in the Event Threshold before they accurate report findings. For example, a Data Watch created that has a threshold of "500 Events per Hour" will take at least an hour before it accurately reports on the Monitor Groups and Monitor Report dashboards.
Editing a Data Watch
Data Watches can be tweaked and tuned after creation. This is useful for creating actionable thresholds and refactoring time spans to reflect ingest rates. To edit a Data Watch, open up the Edit Monitor Group modal, and inspect the list of Configured Monitors at the bottom of the modal.
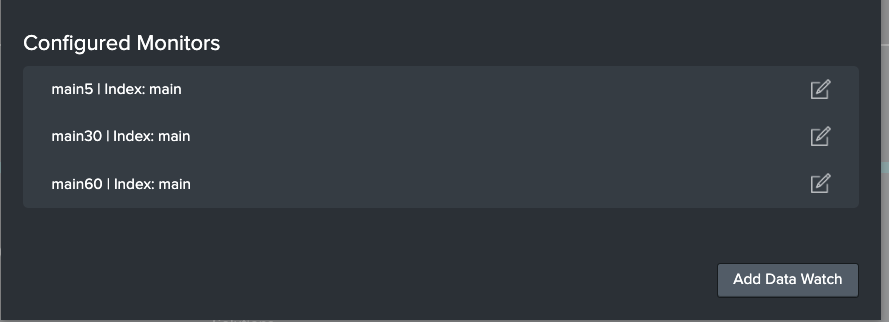
Select the Edit button on the right. This will bring up the familiar Data Watch modal as before. Admins can tweak any of the fields to reflect their updated needs. Admins can also delete Data Watches here.
Changing the Index, Source Type, Source, or Host fields will require the Data Watch an appropriate amount of time as identified in the Event Threshold before giving accurate results.
Data Watch Example
For this Use Case, Alex from IT Security wants to ensure their security dashboards are accurate and up to date in Splunk. To achieve this peace of mind, Alex utilizes Monitor to ensure that if a Splunk data stream fails, they are the first to know.
Alex creates an IT Security Monitor Group to capture all the Monitors they are planning on creating.
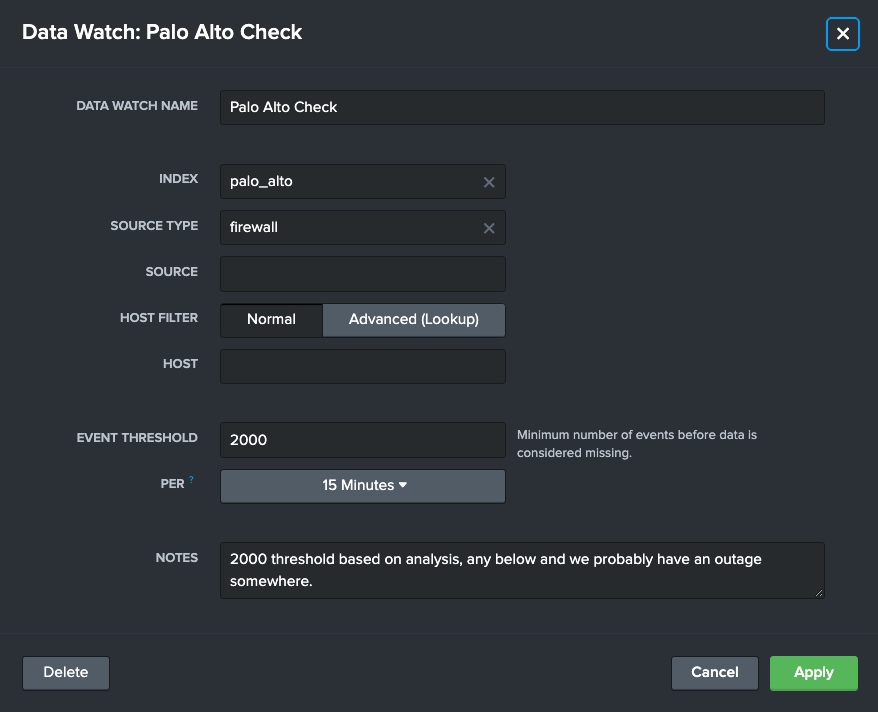
They then add a couple Data Watches. Let's look at one Alex created to ensure that their team is getting the latest Palo Alto network data. This Data Watch would ensure Alex gets alerted if there are less than 2 thousand events every 15 minutes in this Index - Source Type.
Integrating Lookups with Data Watches
Data Watches usually rely on Indexes, Source Types, Sources, and Hosts to properly monitor data, but that can be limiting for some use cases. In some environments, admins may want to only watch a subset of the data belonging to a select few hosts. This information can be stored on Change Management Data Bases (CMDB) or Assets and Identities tables, and can be useful for tracing Splunk data from Index, to Host, to Owner. Data Watch has a lookup integration option to fully capture this use case.
For example, using this functionality, an admin can monitor Network Data by Company subsidiary utilizing a host-subsidiary lookup, without needing to list and update each host in Atlas Monitor.
Integrate a Lookup into a Data Watch
Identify an appropriate Lookup that can be integrated into Atlas Monitor, it should have the following information:
-
Host Field: The Host Field is the field in the lookup that matches the Splunk Host field. This can be an IP Address or the name of a machine. This field will be used to join the Lookup together with the indexed data.
-
Filter Field: The Filter Field is the field that the Host Field will be translated to, by methods of the lookup.
After identifying these two fields, create or navigate to a Data Watch and select the Advanced (Lookup) option on Host Filter on the Edit Data Watch modal. Additional fields should appear:
-
Lookup: Select the Lookup from the dropdown list
-
Filter Field: This is a list of all columns identified in the selected Lookup. Select the Filter Field identified above in the dropdown list.
-
Filter Field Values: This is a multi-value input for all field values that should be attributed to this Data Watch. Press enter after entering a filter to add more.
-
Host Field: This is a list of all columns identified in the selected Lookup. Select the Host Field identified above in the dropdown list.
Fill out the rest of Data Watch as normal and select Apply.
Data Watch Lookup Integration Example
Steven from IT is helping ensure Splunk Dashboards stay up to date for each subdivision of Large Corp. Steven knows that some data coming from the Palo Alto Forwarders belong to the F&A division of Large Corp., but unfortunately it is in a shared index with other subdivisions. Steven doesn't want to have to create monitors for an ever changing list of Hosts that are tied to F&A, especially since IT already has a great Change Management Database that links Splunk Hosts to Large Corp. subdivisions. Luckily for Steven, Atlas Monitor can leverage the CMDB to make monitoring easy!
Large Corp's CMDB, administrative_identity_lookup.csv, is structured like this:
| managedBy | notes | date | identity |
|---|---|---|---|
| Security | n/a | 2020/03/23 | 34.24.12.22 |
| Security | seasonal | 2020/03/23 | maindataselector |
| Finance | n/a | 2021/05/29 | 34.24.13.22 |
| Finance | n/a | 2020/03/21 | 34.24.84.22 |
| Accounting | monthly | 2022/08/23 | accountingSuperHost |
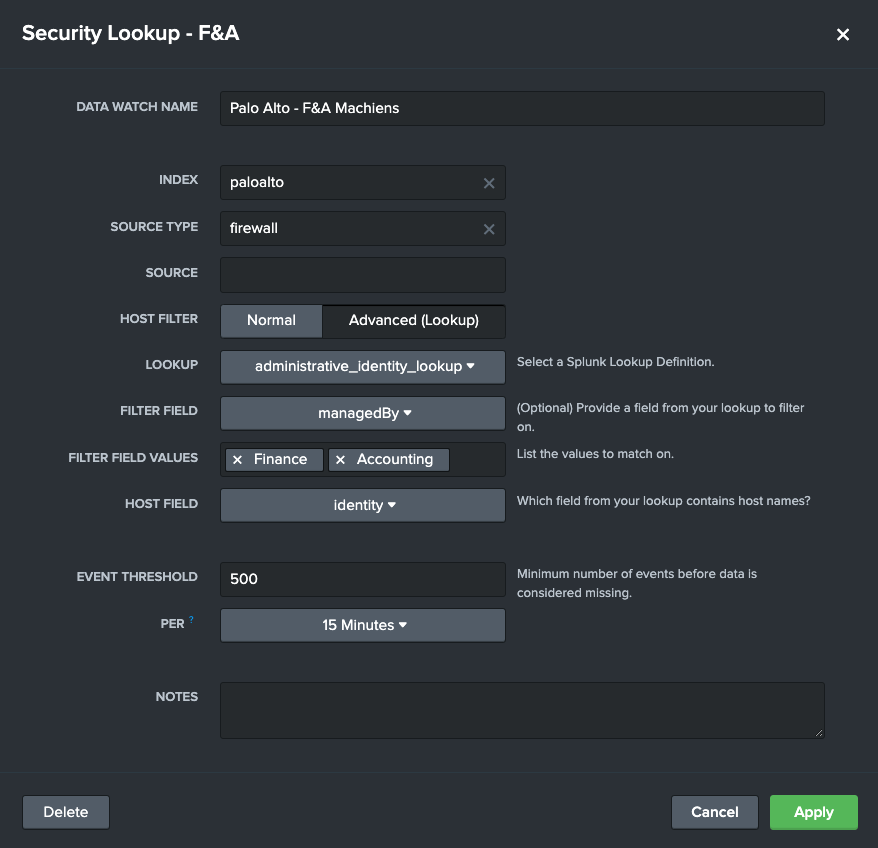
By creating a Data Watch like below, Steven is now tracking data from the palo alto index that is coming from the 3 hosts that belong to Finance and Accounting. This is incredibly useful since if the CMDB is updated, the Data Watch will also update automatically.
Creating and Using Base Searches
Data Watches usually rely on Indexes, Source Types, Sources, and Hosts to properly monitor data, but that can be limiting for some use cases. In some environments, admins may need to create custom searches that reference search time fields and utilize eval commands. While Atlas users can create Standalone Custom Data Watches to meet these needs in Monitor, with Base Searches, admins can leverage Atlas Monitor to not only track these unique data streams, but do so in an effective and reusable manner. With a Base Search, one search can populate multiple Data Watches, and can be split based on field values.
For example, using this functionality, an admin can monitor log-in data from multiple company subsidiaries by utilizing a Base Search that joins account fields lookup with an Active Directory lookup. Using this Base Search, the admin can then build multiple Data Watches for the many subsidiaries.
Creating Base Searches
In order to create a Base Search, you must first navigate to the Base Search Configuration tab. Here you will find a list of the currently available Base Searches, which you can edit by clicking on the pencil-and-paper icon beside each search. If you have many Base Searches in your environment, you can filter the list with the search bar in the upper-left corner of the page.
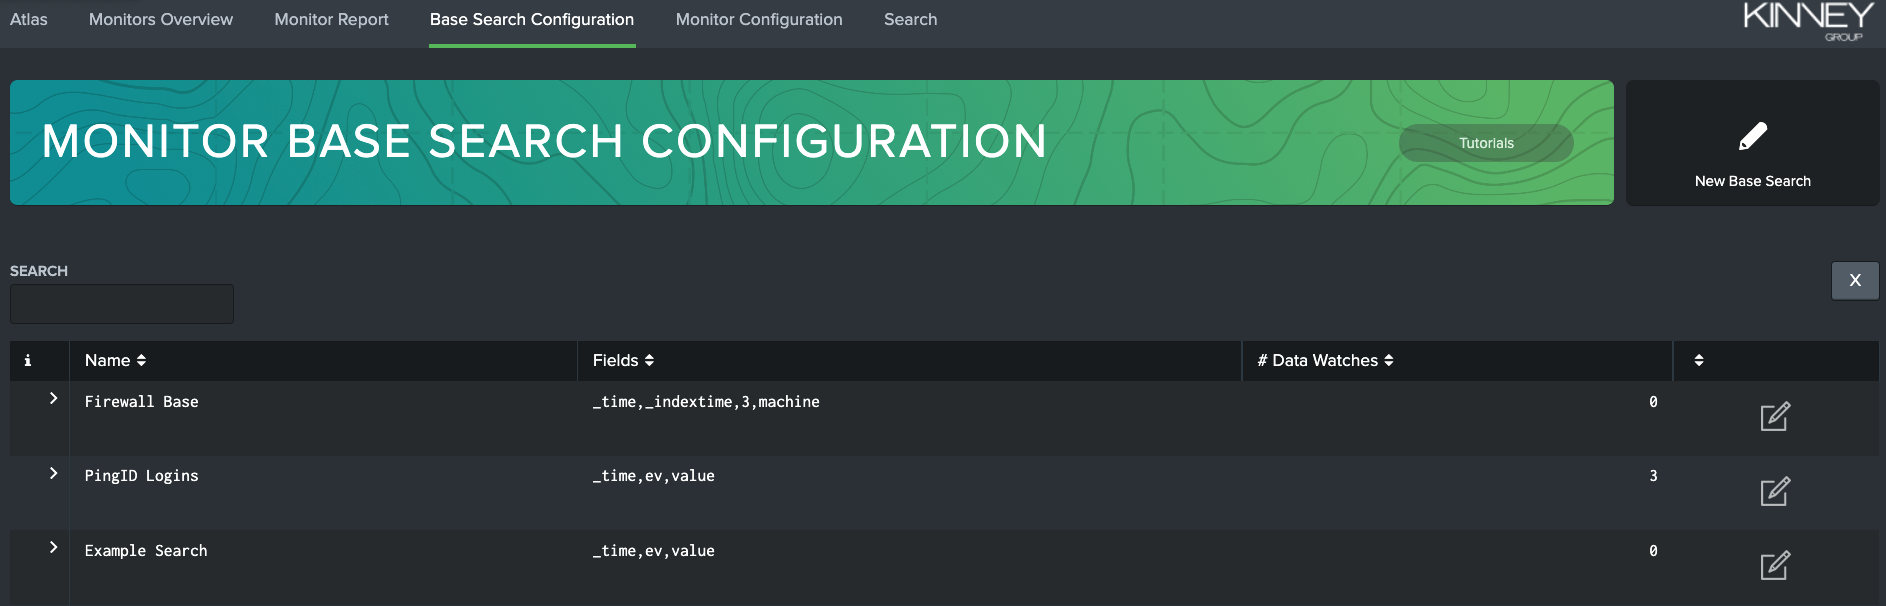
Now, you can click the New Base Search button on the right-hand side of the banner. This brings up the "New Search" modal. This is the same modal that appears if you edit an existing Base Search, except the "New Search" text will be replaced with the name of the Base Search.
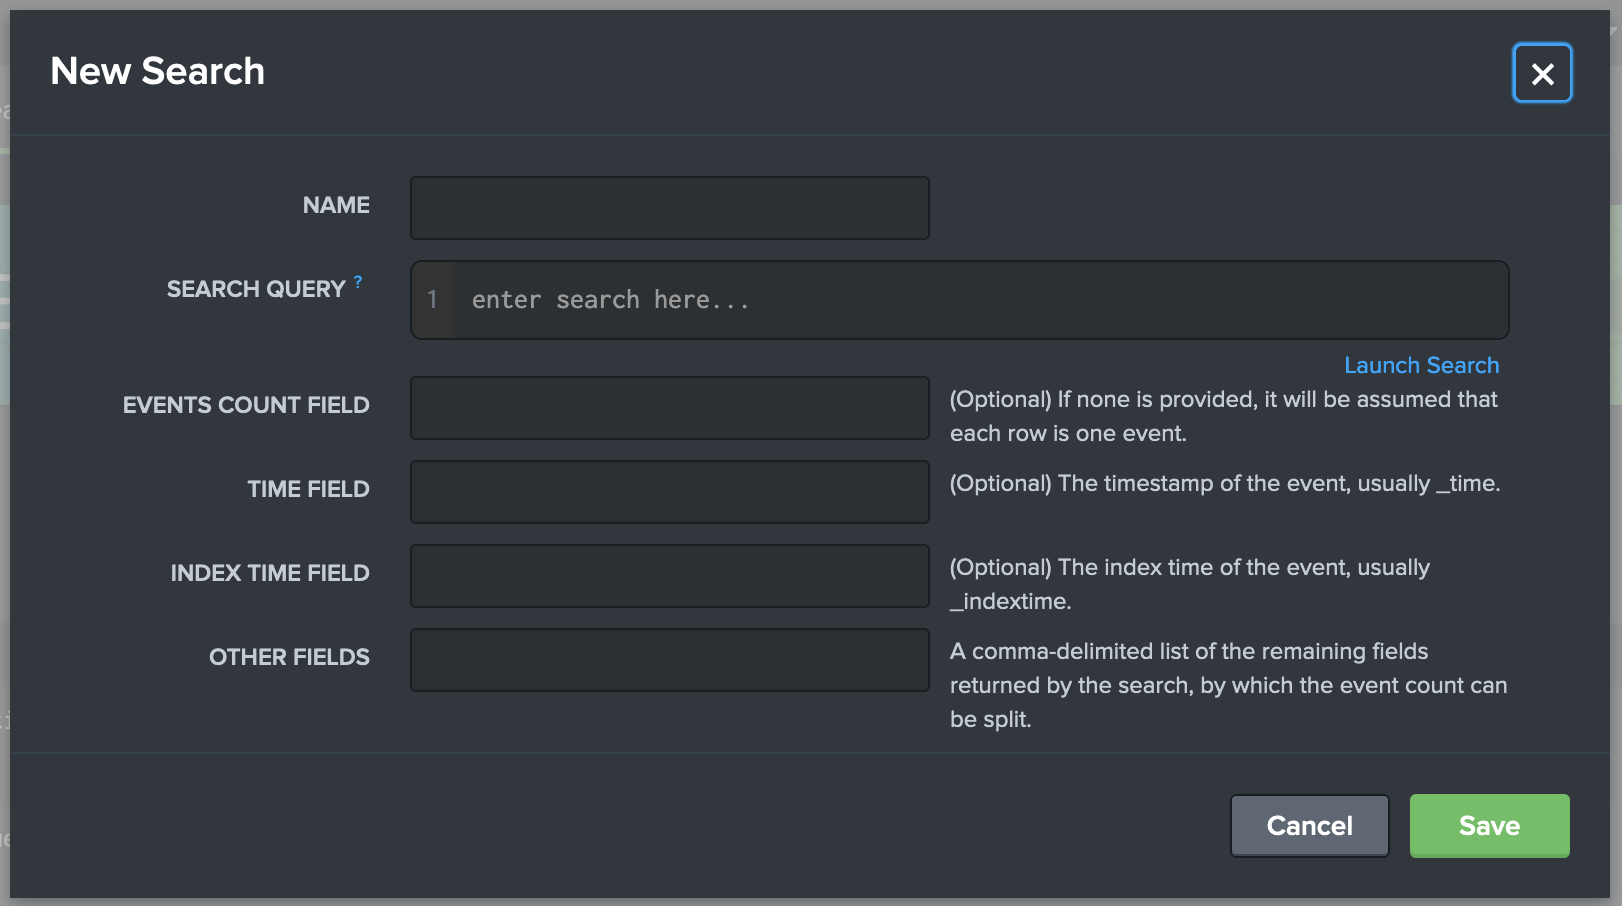
Next, fill in the fields provided in the modal as such (* indicates a required field):
-
Name*: desired name for your Base Search
-
Search Query*: the SPL that defines your Base Search
Your SPL Search needs to be started with a command such as '| search'.
It will also perform better if it ends in a transforming command such as '| stats'.
-
Events Count Field: a field that your SPL search returns that identifies the amount of events found
-
Time Field: the field that your SPL search returns that identifies time the event occurred
-
Index Time Field: the field that your SPL search returns that identifies the time the event was indexed
-
Other Fields: a list of the other fields returned by your SPL that can be split upon later in Custom Data Watches
Here is an example of these fields filled out to create a test Base Search:
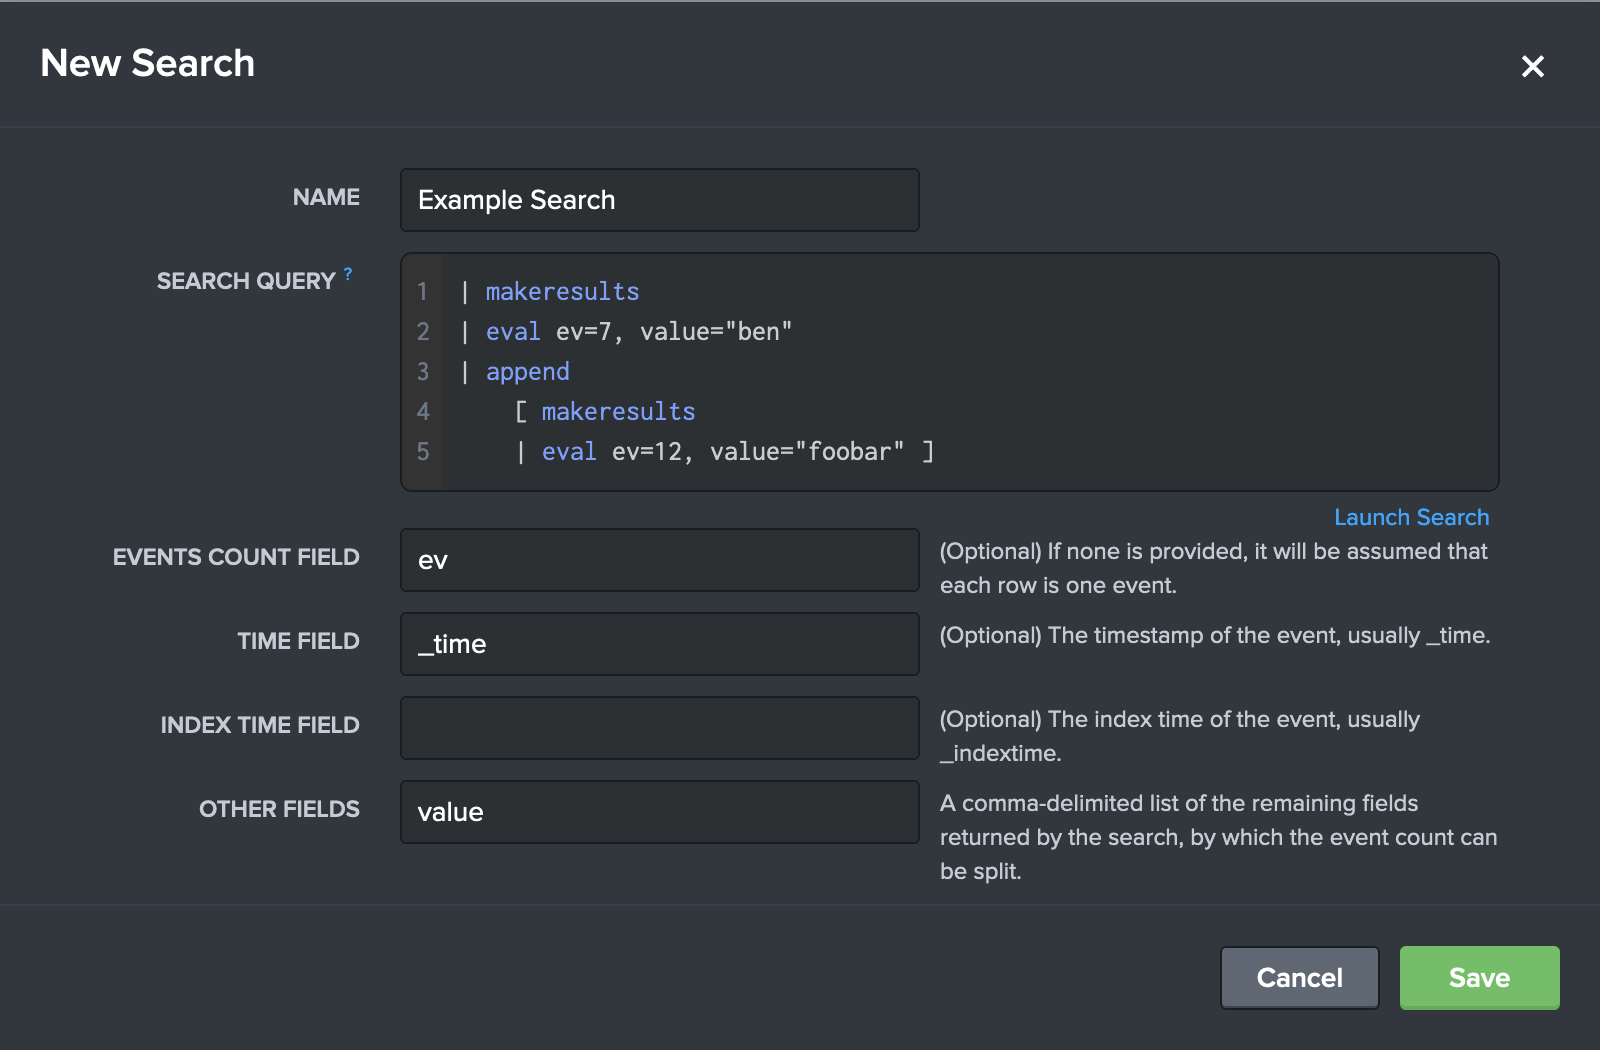
The new search now appears in the list of available Base Searches.
Creating Custom Data Watches with Base Searches
Your new Base Search can now be added to existing Monitor Groups! Simply navigate to the Monitor Report tab. Then, select an existing Monitor Group from the dropdown select on the left-hand side of the page. If you'd like to add your Base Search to a new Monitor Group, create it on the Monitors Overview tab and then select it using the same method as above. Once you've selected the desired Monitor Group, click the Edit Monitor Group Name button in the top-right corner. This button brings up the Edit Monitor Group modal.
Within the modal, click "Add Custom Data Watch" in the bottom-right corner. This will now bring up the "Create Data Watch" modal. Your new Base Search can be selected from the Base Search dropdown select.
After selecting a Base Search, the admin can add new 'Split By' fields. This enables admins to split the original base search by any identified fields in the Other Fields configuration of Base Searches. Admins can add multiple fields that if any match will be counted for this Custom Data Watch.
You've now learned how to create Base Searches and add them to your Data Watches.
Data Watch Base Search Example
Jake needs to be the first person to know if one of the many data centers has stopped sending in firewall data. The firewall data coming in has a field that denotes it's origin, but unfortunately this is not an indexed field like index or host. Not to worry, Jake can still fulfill this alerting use case in Atlas Monitor using base searches, and it will be more efficient than building out numerous alerts for each data center.
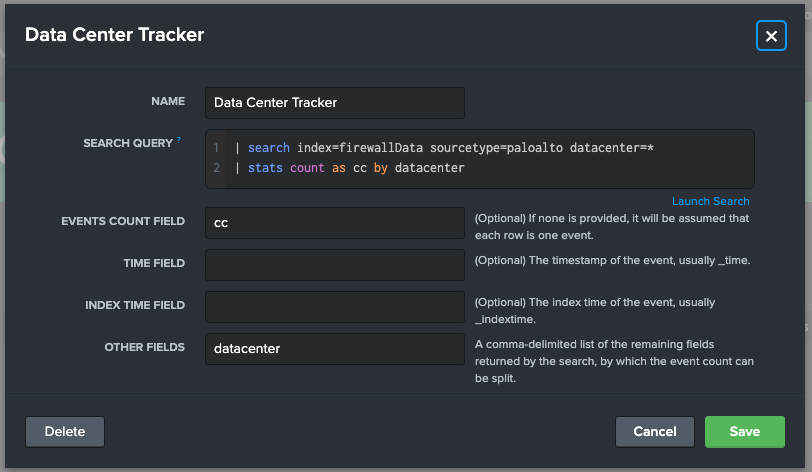
First, Jake needs to create a base search that tracks the firewall index, and tracks events per data center. He navigates to Base Search Configuration page and creates a new Base Search.
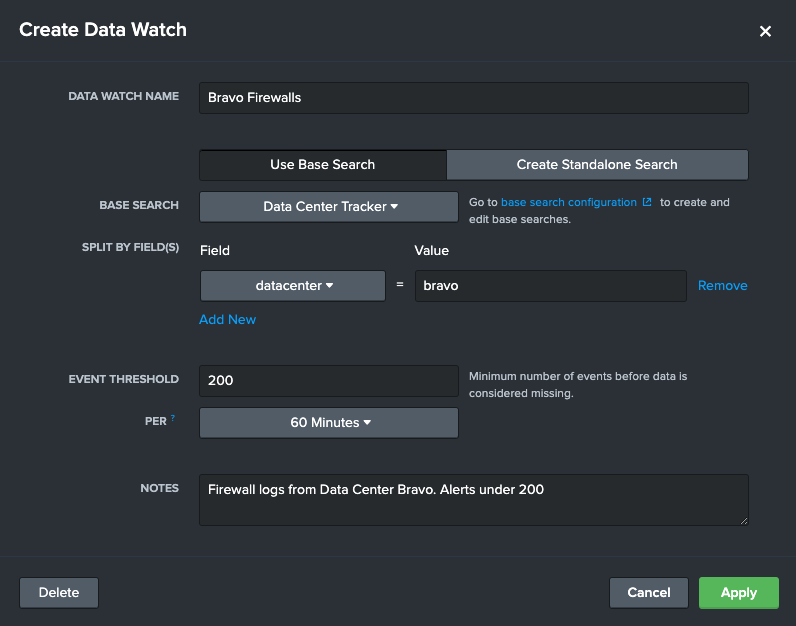
After hitting Save, Jake then navigates to the Monitoring Group belonging to Data Center Bravo. He wants to add a Custom Data Watch tracking firewall data from Data Center Bravo so he is alerted if this particular data center fails to send data to this index. Jake creates the a Custom Data Watch.
Jake now has a Custom Data Watch that alerts him if events from the firewall index, and more particularly from the Bravo Data Center, falls under 200 events an hour. Jake can now create more of these Custom Data Watches leveraging the same base search for other data centers.