Using Atlas STIG Compliance
Application Overview
The Atlas STIG Compliance app aggregates the STIG compliance data it is provided so that you can visualize and report on the overall compliance health of your environment. This is accomplished by creating Systems in the STIG Compliance user interface. Targets are assigned to Systems to create an overall health score of the systems.
Navigation
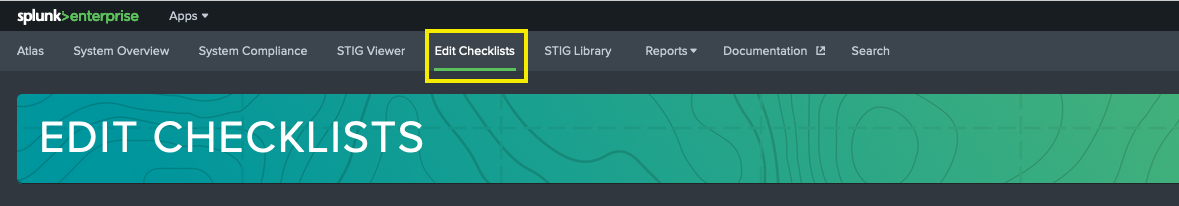
Navigation in STIG Compliance is based on three primary views of the data. These views are reflected in the navigation bar across the top of the page. The primary views are.
- Systems: Systems are collections of Targets.
- Checklists: Checklists are the STIG checklists that have been created for each Target.
- Targets: Represent the IT asset where a STIG is being applied.
In the navigation bar you will find a drop down menu for each of these views.
- Systems
- System Overview
- System Compliance
- Checklists
- STIG Viewer
- Edit Checklists
- Targets
- Target Overview
Following these data centric views are these more specified pages and collections focused on unique use cases and for referencing and exporting data:
-
STIG Library
-
Reports
Systems Dashboards
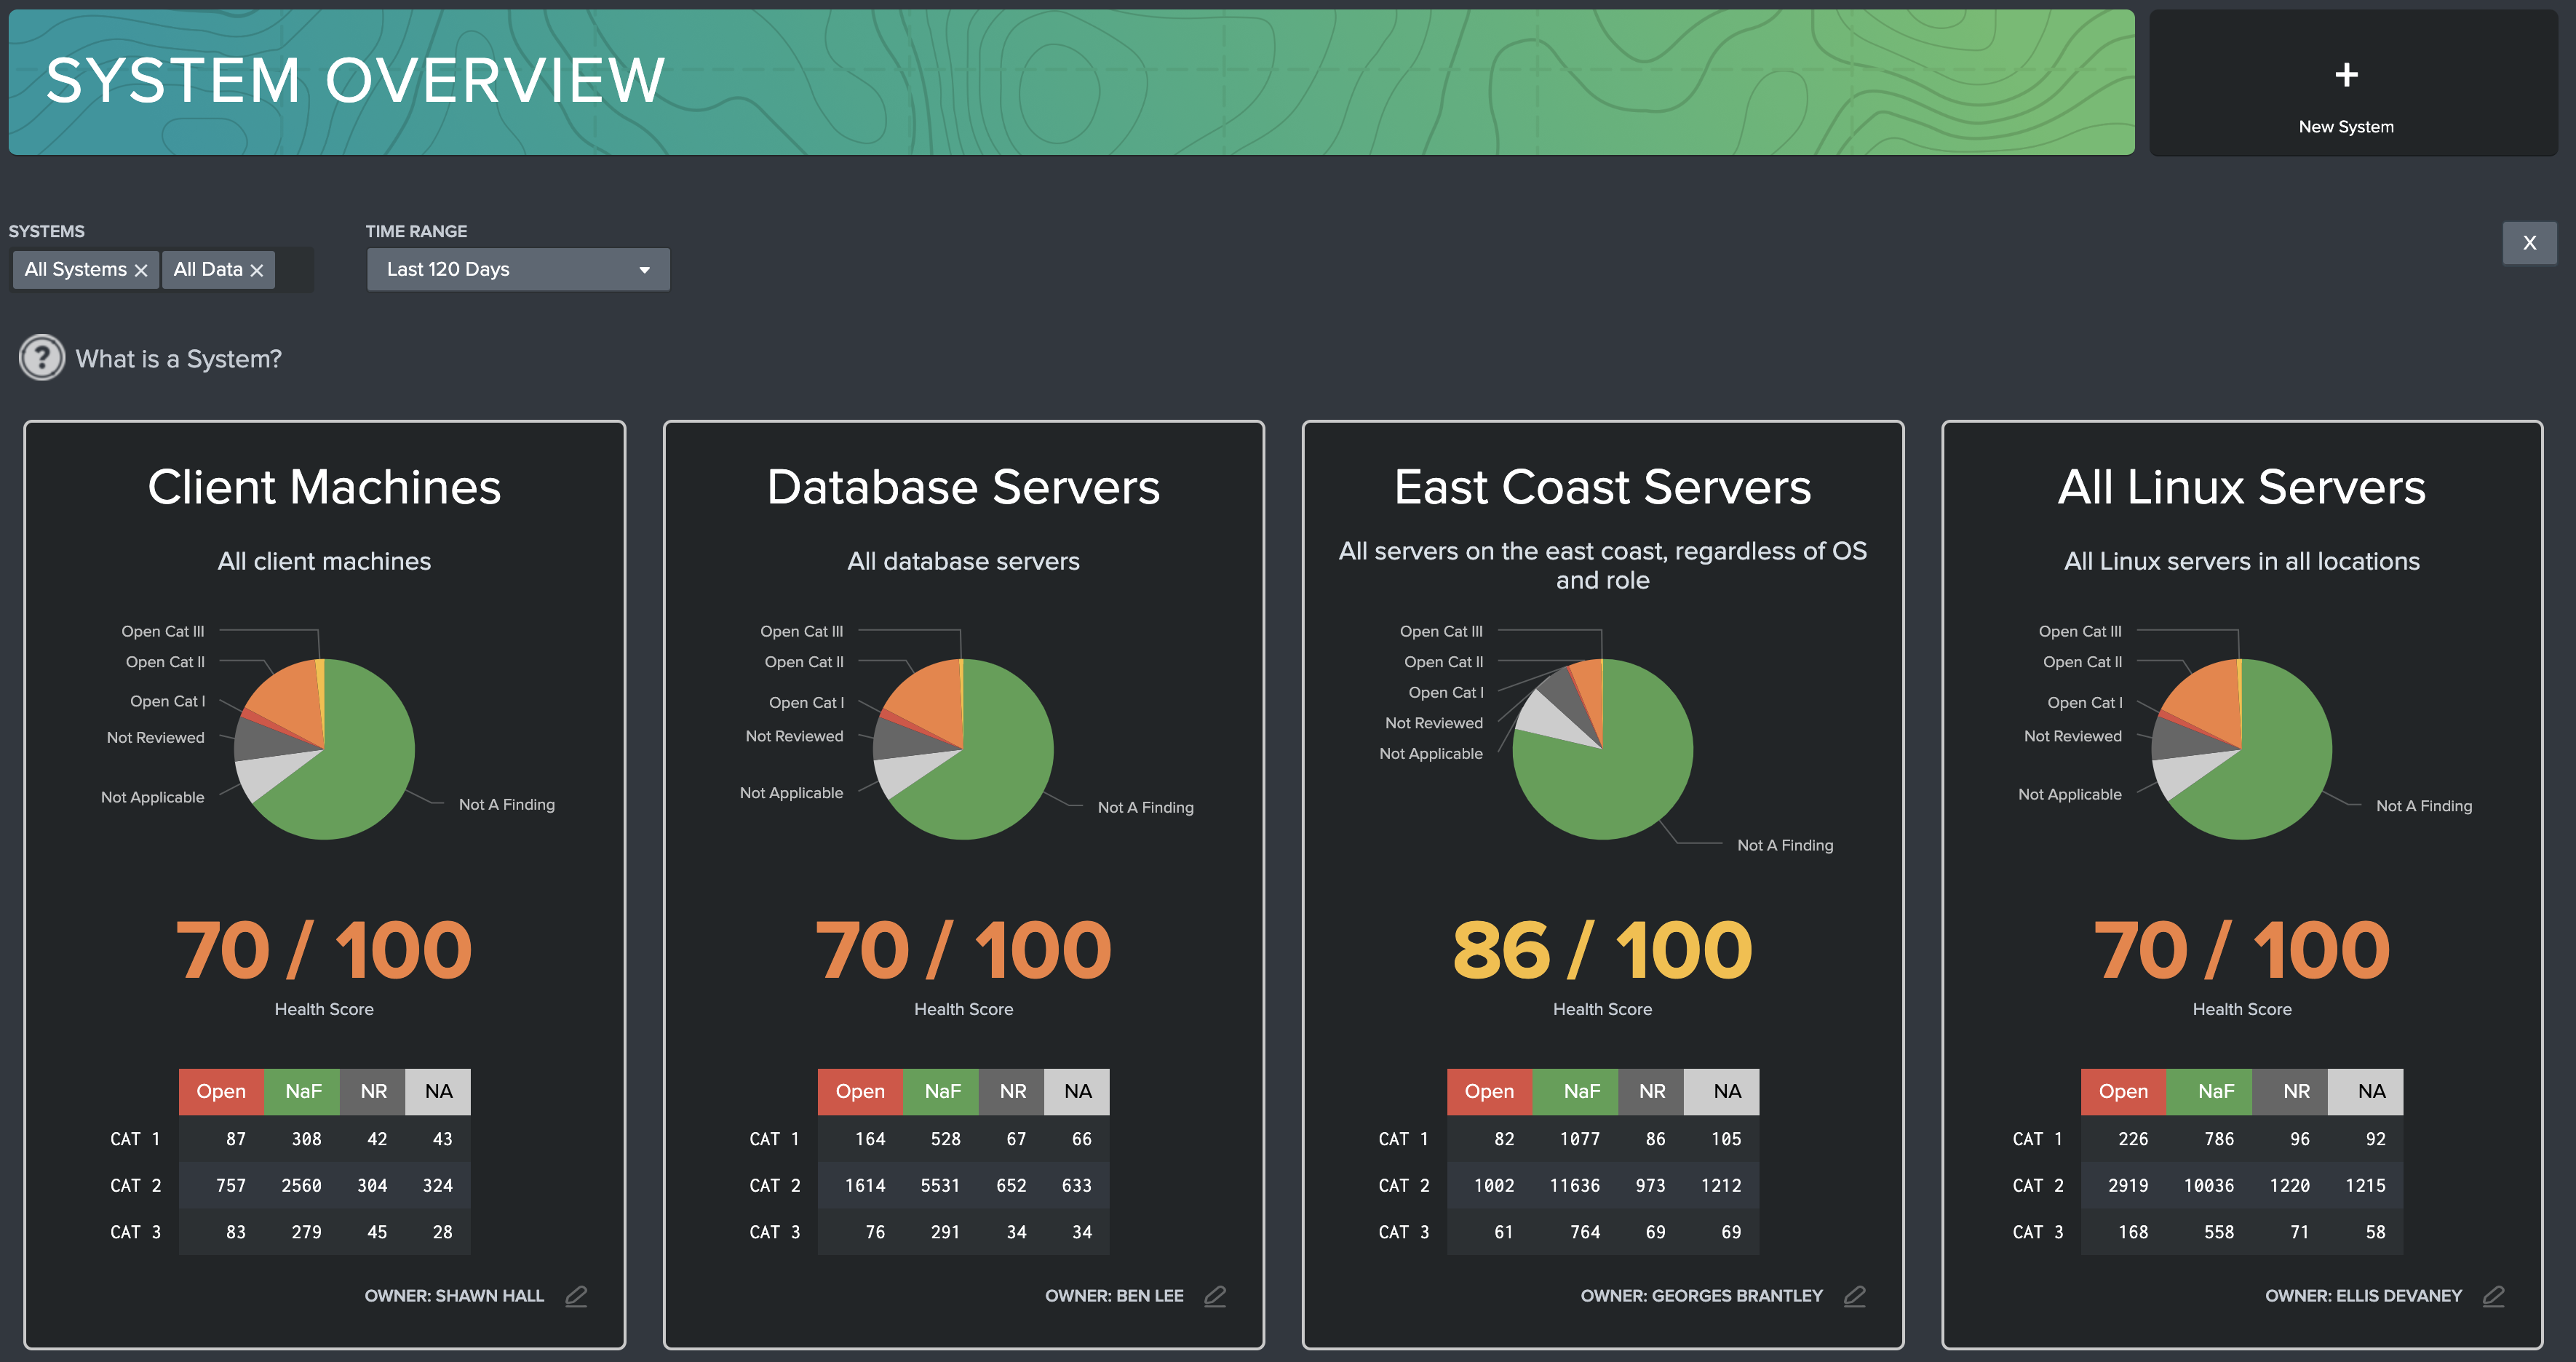
System Overview Dashboard
This dashboard can be used to get a quick view of compliance health across all of your defined systems. The purpose of this dashboard is to group compliance targets into systems, and show an overview of each individual system known to the STIG Compliance app. Each system is broken into individual tiles on this dashboard. Each tile contains a visual of vulnerabilities sorted by status, a calculated health score, and a trend line showing the health score over time.
-
Filters: Use the filter to filter out systems and time range of reported data. STIG Compliance always reports the most recent system data, but the Time Range picker can be used to adjust system health score trend lines.
-
System Tile: Overview for each specific system. The name and description of each system is listed at the top of the tile. Clicking anywhere in this tile will navigate the user to System View dashboard, filtered for the specific system selected. If multiple systems are defined, a ‘Selected Systems’ tile will appear, giving an overview of all targets that have been grouped into systems. Additionally, an ‘All Data’ system is generated by default, which contains all compliance data known by the STIG Compliance app.
-
Overview Pie Chart: Displays the relative number of findings for that system, categorized by their status: Open CAT 1/2/3, Not a Finding, Not Reviewed, or Not Applicable.
-
Health Score: Weighted average, where 60% of the score is calculated by the ratio of Open CAT 1 findings to total CAT 1 findings, 30% comes from the ratio of open CAT 2 findings, and 10% comes from Open CAT 3 findings. If a checklist or target lacks any vulnerabilities in a severity (for example, no CAT I vulnerabilities), then the health score will ignore that severity in its calculations. Additionally, a trend line shows how the health score has improved/degraded over time as findings are mitigated or added to the system.
-
Vulnerability Chart: Table of all vulnerabilities by status and by category level. This is useful for identifying systems with issues at a glance.
-
Add New System: Click this button to add a new system definition. A modal will appear on screen which allows you to name your new system, then assign targets to the system. The Targets search bar allows you to search your system for targets that have compliance data associated with them. Additionally, you can create a target that you anticipate will be introduced to the system once data is ingested. All data will be associated with the newly created target based on its hostname. The number in grey to the left of each target shows how many data sources have been ingested for the given target. The Description field will appear as a subheading on the System Tile and can be used to store additional description of system. Finally, you can assign ownership to the system by designating an owner and contact info.
-
Edit Existing System: Click on this button to view information about the selected system. Here System Administrators can edit or delete systems. Users will have the ability to view system information, however, will not be able to change any of the fields.
Adding a New System
You will need to create a System in the STIG Compliance App in order to group together targets that make up a logical system in your environment. A target can be associated to more than one system. Creating and editing systems is done in STIG Compliance App UI after data has been brought into Splunk. To add a new system use the following steps:
-
Click on the Add New System button in the top right corner of the System Overview Dashboard. The New System Modal appears.
-
Provide a name for your system in the System Name field
-
For adding targets specifically or by pattern, follow these steps.
-
You can also use the Targets field to create a custom target that is not yet indexed in Splunk. This helps if you want to add a Target that you know will eventually be added. This will show in your list but will not impact your health score until compliance data is available.
-
Provide a description of your system in the Description field. This will be the description that appears in the system tile on System Overview dashboard.
-
'Owner' is a text field that allows you to provide the name of a system owner. This will appear on the system tile on the System Overview dashboard.
-
'Contact Info' is a text field that allows you to put information for how to contact the system owner. This will appear on the system tile on the System Overview dashboard.
-
Hit the Save button to save your system. The new System tile should appear immediately after the page refreshes.
Editing an Existing System
To edit an existing system, click on the icon that appears in the bottom right corner of each tile. This will open the System edit modal. On this screen you can modify some of the fields of a System.
-
Click on the icon that appears in the bottom right corner of the desired system tile
-
Modify the System Description
-
Modify the System Owner
-
Modify the Contact Info
-
Click the Save button when done making changes to the system
-
The tile will be updated immediately once the page refreshes
Adding Targets to Systems
Systems require Targets to be assigned to them in order to report data. A target is a computing resource such as a server, computer or network device that has STIGs being applied to it. A target can also be a non-computing resource as well. Targets can be assigned to Systems one of two ways on the System modal, Add By Name, or Add By Pattern.
Add By Name
Targets can be added by host name. To do this, search the Available Targets table for the target of choice, and click it. It will then appear on the Selected Targets table. This selection will override any ignore patterns done by Add By Pattern.
Targets can be removed from a System by selecting it from the Selected Targets table. Ensure that the target is not being captured by a pattern in the Preview section.
Add By Pattern
Multiple targets can be added at once using Add By Pattern. Input a pattern into the Allow List and any target with a matching Host Name will be added to the system. If a target is later added to the Splunk system after this rule was created, it will be automatically added to the System. This empowers users to set up system definitions that stay accurate with new data ingests.
Users can also populate a Deny List. These patterns will remove any targets added by the Allow list that match those patterns. The Deny List does not remove targets which were selected by Add By Name.
Acceptable patterns include any characters or digits, and '*' as wildcards. Wildcards match on anything or nothing. For example, the pattern "win*" would match on targets win22, win_45, win, but not prefix_win45. Patterns can have multiple wildcards, so for example the '*win*' pattern would match on prefix_win45, and just windows.
Patterns can be separated in a comma separated list, such as:
> win\*,\*linux\*,test_server
The output of the Allow List and Deny List can be inspected in Preview.
Preview
The Preview section shows what targets are going to be added to the System and by what rule (NAME for Add by Name, or PATTERN for Add by Pattern). Targets added by name take precedent, and are not removed by any rules in the Deny List. Targets Added by Name and that match a pattern in the Allow List will be listed as Added by Name. Users can use the search box to find specific hosts to double check pattern selection.
When the system is created or saved, this current list of targets will become the current target list. This may change automatically as new targets matching the Allow List (and not matching the Deny List) have their CKLs ingested.
System Compliance Dashboard
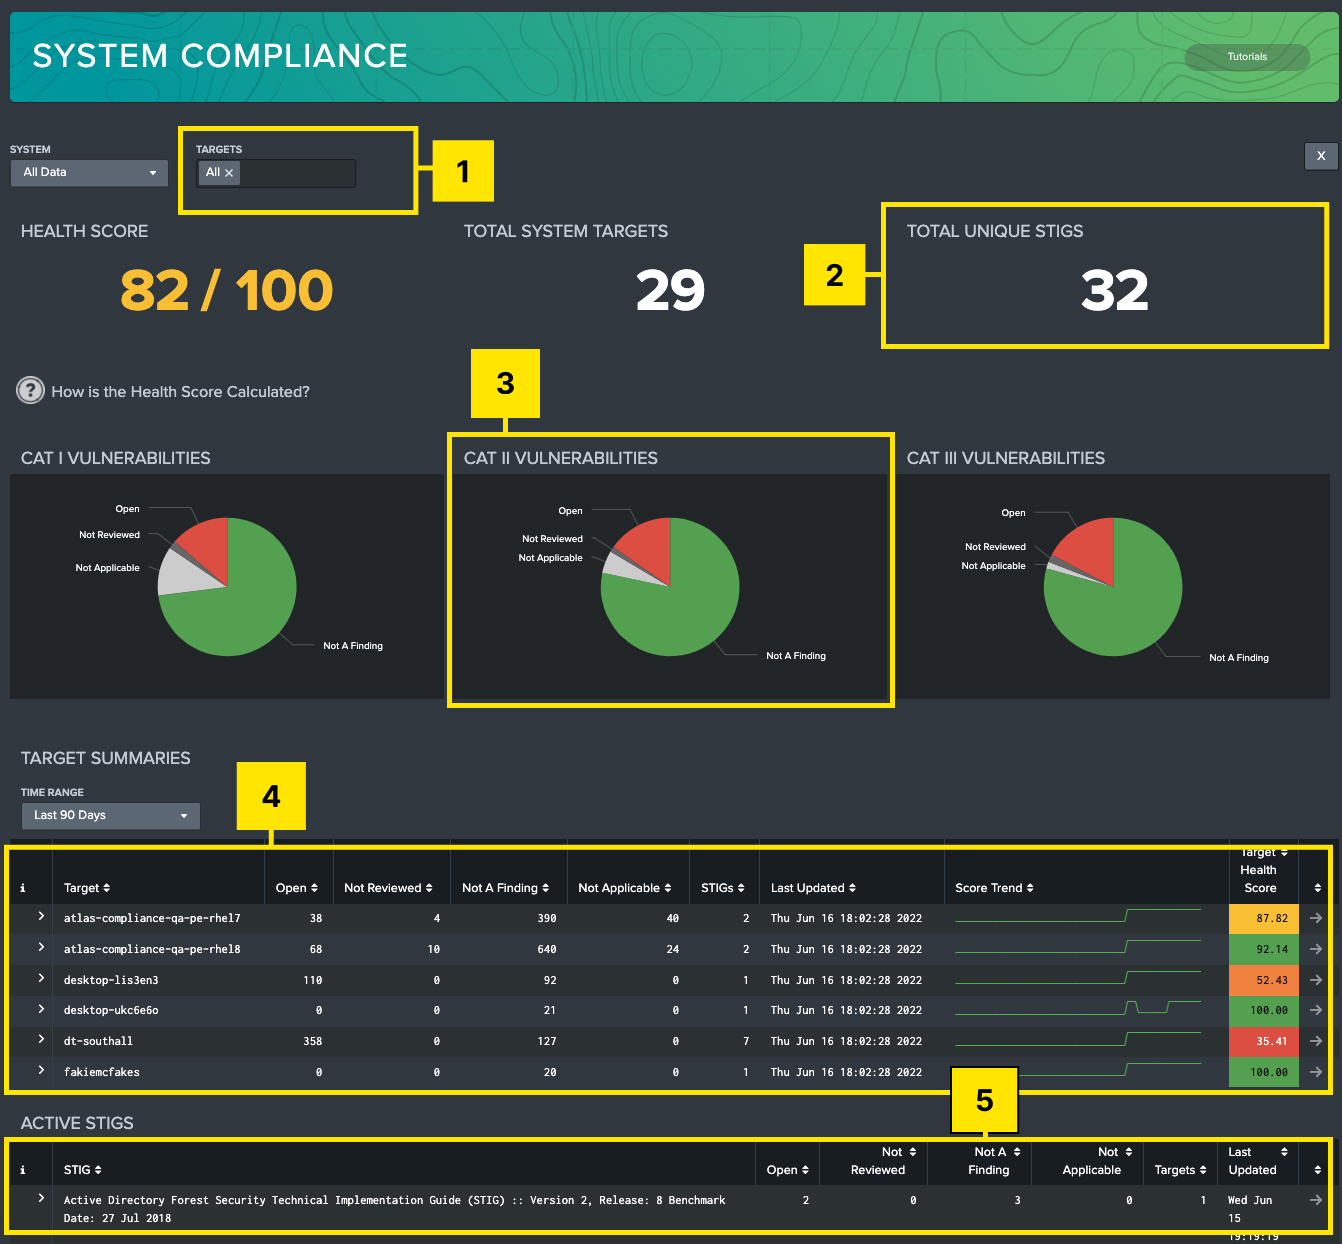
This dashboard can be used by system owners or maintainers to get a detailed overview of their system. This dashboard includes a system overview, containing the heath score of the system, the number of target machines contained in the system, and the total number of unique STIGs being tracked for the system. Additionally, vulnerabilities are displayed by severity (CAT 1/2/3) in separate graphics, which show the relative amount of Open, Not Reviewed, Not Applicable and Not a Finding statuses in each severity category. Finally, two tables summarize the data captured for the system sorted by Target Machine, and by STIG.
-
Filters: Use the filters to change visibility to sort by systems, or targets within the system.
-
System Summaries: Provides System summary data, including a System Health Score, total number of machines within the system, and how many unique STIGs are being tracked for that system.
-
Vulnerability Summaries: Each pie chart groups vulnerabilities of the system by their severity. Hovering over any piece of the pie will show the total amount of vulnerabilities in that selection. Clicking on a slice of the pie will produce an additional table which shows all vulnerabilities selected from that group.
-
Target Summaries Table: This table lists all targets that are part of the system, along with a summary of vulnerability statuses. Only the data for current STIGs will be displayed in this table, meaning that if you have a target that has compliance data for a STIG that is out of date, it will not be displayed in this table. In this view, each target is given an individual health score, which is calculated based on all STIGs that apply to that target. Additionally, a Score Trend tracks the daily health score over the time range selected by the time range filter above the table. Selecting a row will navigate the user to the STIG Viewer dashboard, with the selected target pre-filtered.
-
Active Checklists Table: This table lists all available checklists associated to a system with version info and a summary of vulnerability statuses. This table only displays current STIGs (STIGs that are in the STIG Library). Selecting a row will navigate the user to the STIG Viewer dashboard with the selected STIG pre-filtered.
Checklist Dashboards
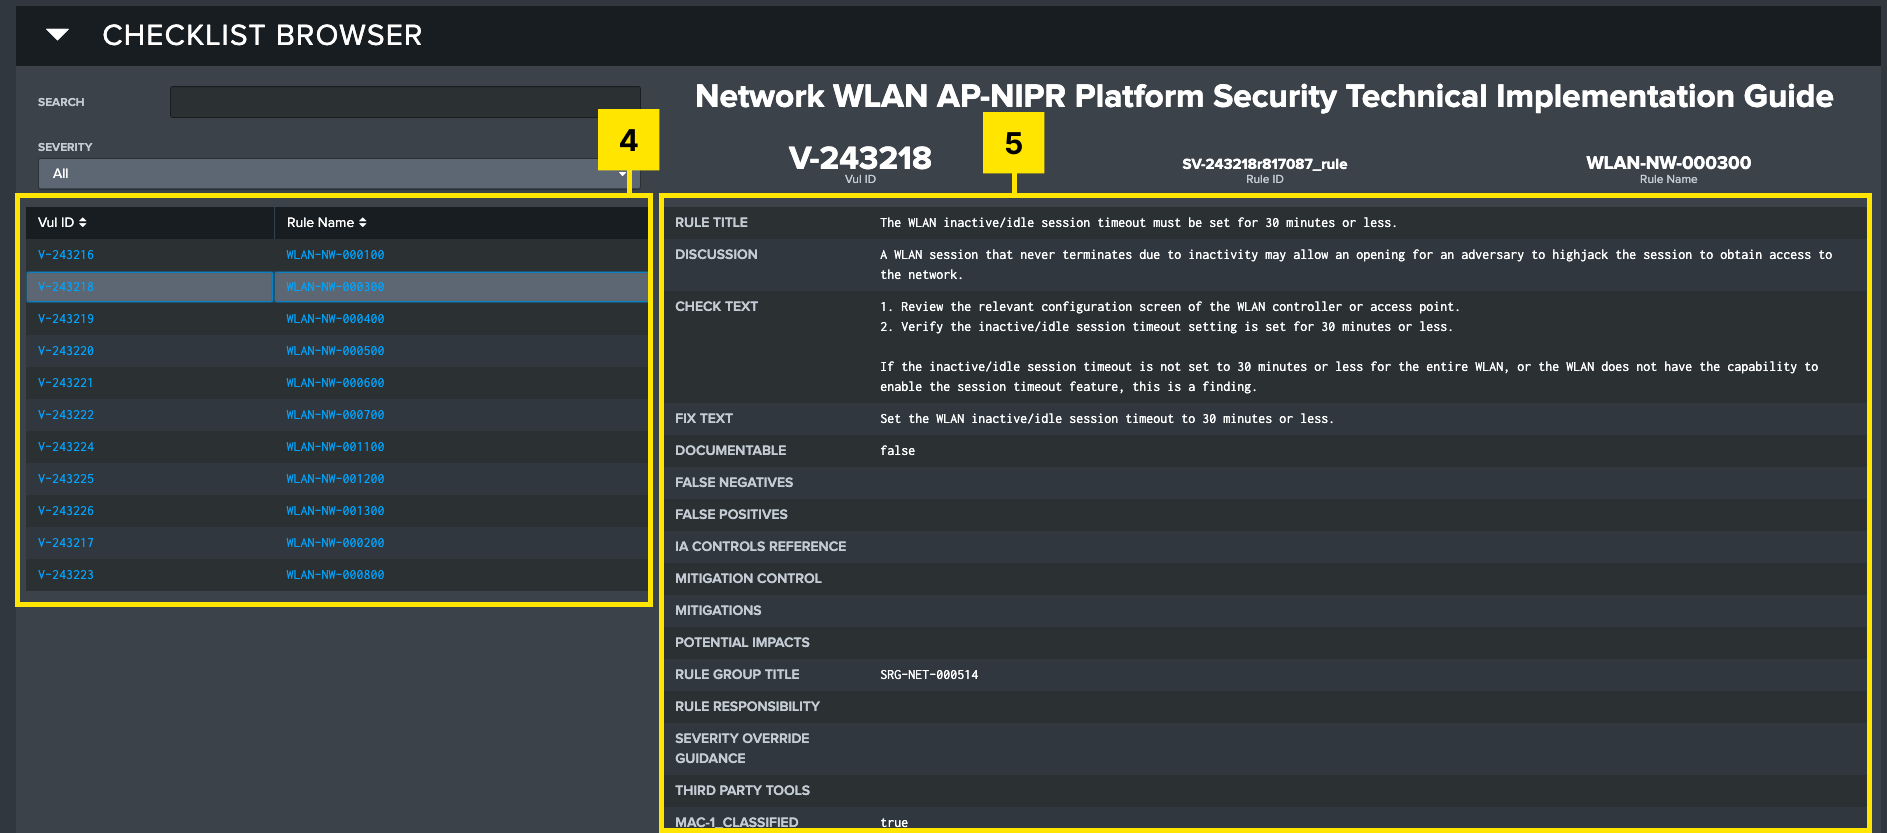
STIG Viewer Dashboard
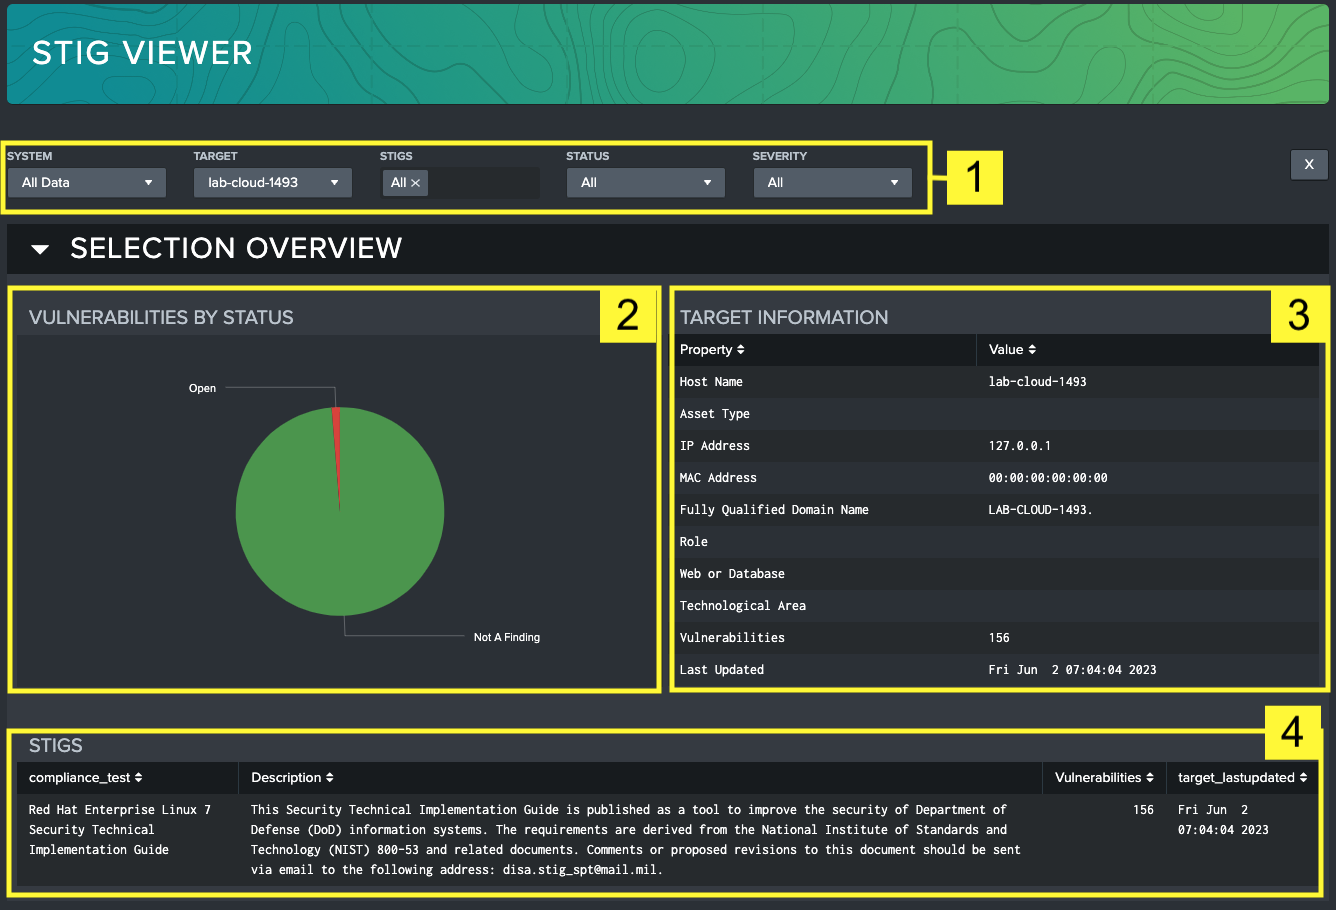
This dashboard is designed for a system maintainer or auditor to view the details of individual controls. The purpose of the STIG Viewer dashboard is to provide an in-depth view of a single target machine and all applicable STIGs and controls associated with that target. The dashboard is broken into two sections:
-
The top section of the dashboard, labeled Section Overview, provides an overview of the target or targets selected by the filter. A summary of controls sorted by severity gives a visual representation of the compliance status of the target, and the tables below queue the user in to selected target(s), and all associated STIGs available for review.
-
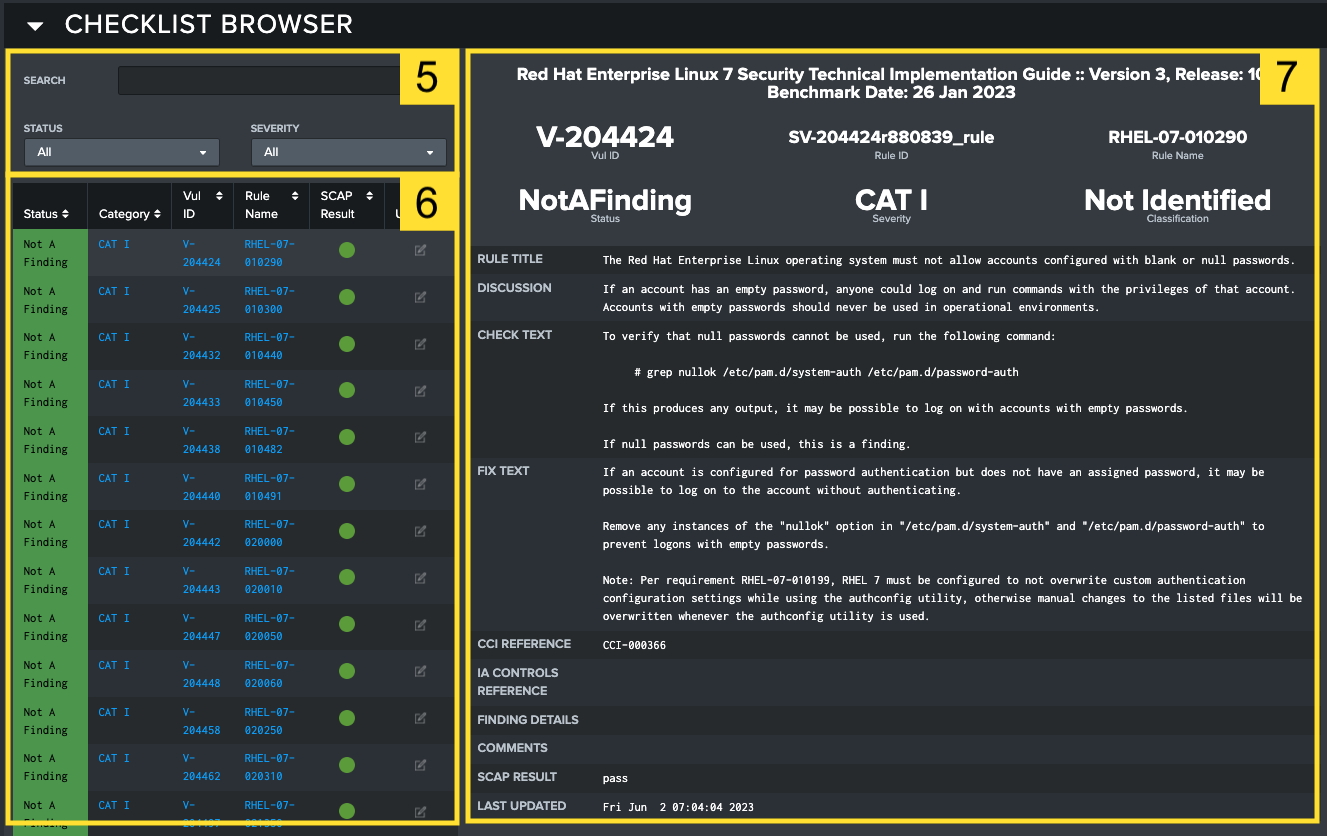
The bottom section, labeled Checklist Browser, provides a detailed view of each individual control. This view is meant to mimic the functionality of the DISA STIG viewer, with the exception that multiple checklists can be searched and aggregated at once, providing a more comprehensive view of the target machine.
-
Filters: Use the filter to change visibility to sort by systems, target machines, STIG, status or severity.
-
Vulnerabilities by Severity Overview: Shows a relative breakdown of statuses of vulnerabilities.
-
Target Information: List of identifying information about the selected target such as its IP address, MAC address, domain name, and role within the system.
-
STIGS: Table that displays all (unless filtered) STIGs that apply to the selected target, with some high-level identifying information about each STIG.
-
Filters: Further filter based on keywords found in the text of the vulnerabilities. Vulnerabilities can also be sorted by status and severity using the dropdown lists.
-
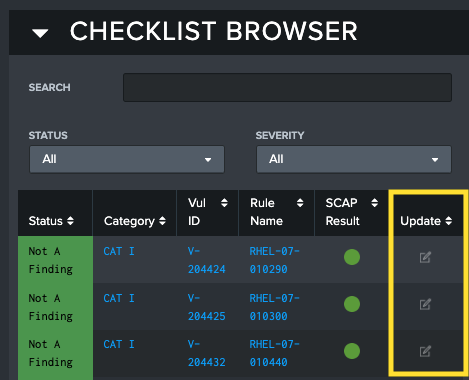
Vulnerabilities table: All vulnerabilities for the selected target(s) and STIG(s). Here you can see an aggregate view of all vulnerabilities within your filter criteria. Table headings help you sort that table by applicable column, such as status or category. Selecting a row in the table will populate the Vulnerability Overview section on the right side of the page. If SCAP data is present, an icon appears in the right column showing the scan results. Green represents passing scans, while red represents a failed scan. If multiple targets are included in the filtered view, there are additional color combinations to represent a mixed dataset. Grey outlines around the circle will always indicate that there is missing SCAP data for one or more targets. In the case that there are targets that have both passing and failing scans, a half red – half green indicator appears. Below is a list of all the potential indication scenarios, but for simplicity: Green is passing, Red is failing, and a grey outline means SCAP data is missing for that vulnerability. Selecting the button in the Update column will open up the Update Vulnerability modal for updating the specific vulnerability on the STIG Viewer dashboard.
SCAP Scans typically do not cover every vulnerability in a STIG, so it should be expected that some vulnerabilities will never have a comparable SCAP scan and will always present an icon indicating that no SCAP data is found.
-
Vulnerability Overview: Lists all fields for the selected vulnerability, including identifying information, Fix Test, Discussion, Check Text, and other applicable fields.
-
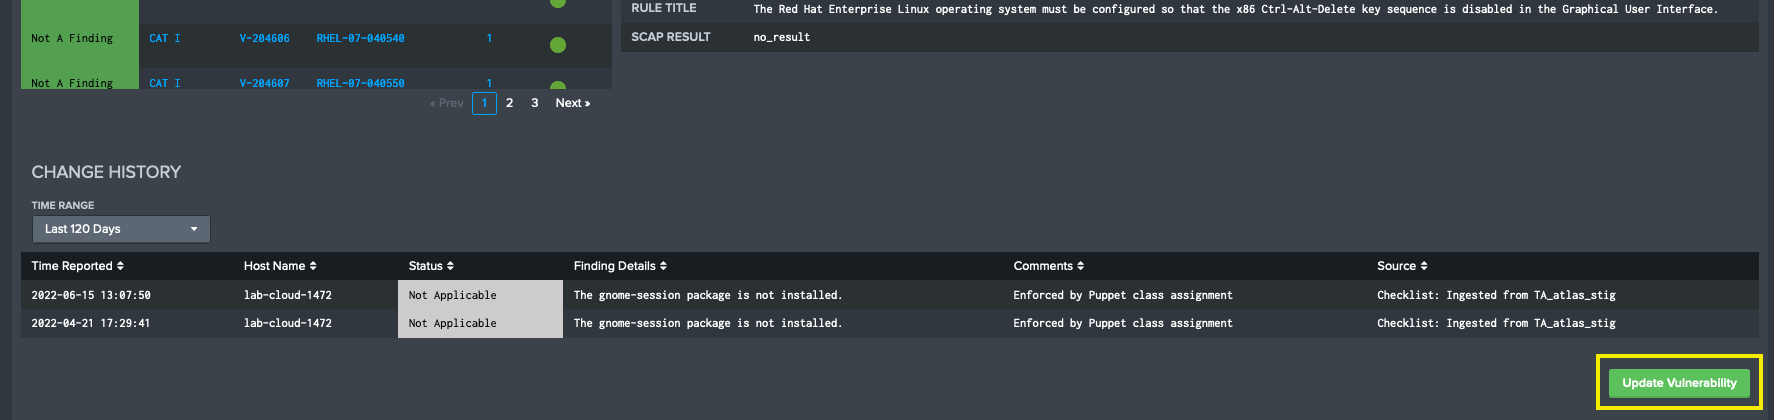
Change History: Shows an audit trail of every time the vulnerability was ingested or changed within the STIG Compliance App. A timestamp and source information are included for each entry. Use this table to track changes over time for a specific control. The time range filter above the table can be used to adjust the time window.
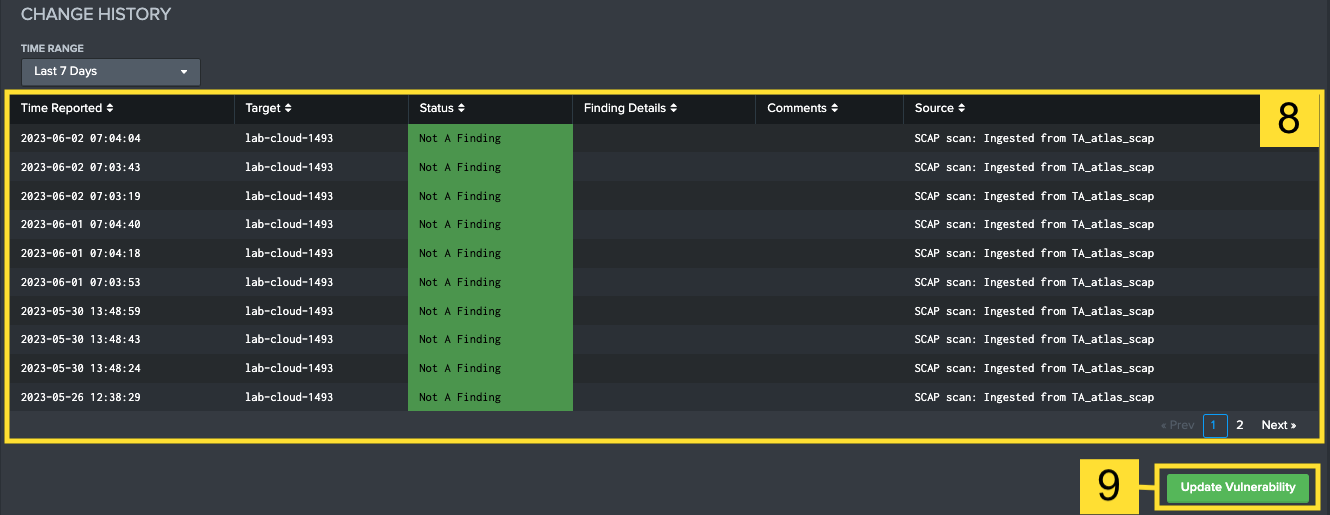
- Update Vulnerability: Will send the user to the Edit Checklists dashboard with current filters applied, allowing the user to edit information about this vulnerability.
STIG Viewer SCAP Status Indicators
The SCAP scan indicator is designed to provide a quick visual reference for what the latest status of a SCAP result is. Use the table below as a reference for each SCAP icon that may appear.
| Status Icon | Icon Definition |
|---|---|
| Passing SCAP scan results | |
| Failing SCAP scan results | |
| No SCAP results found |
Editing Checklists in the STIG Compliance Interface
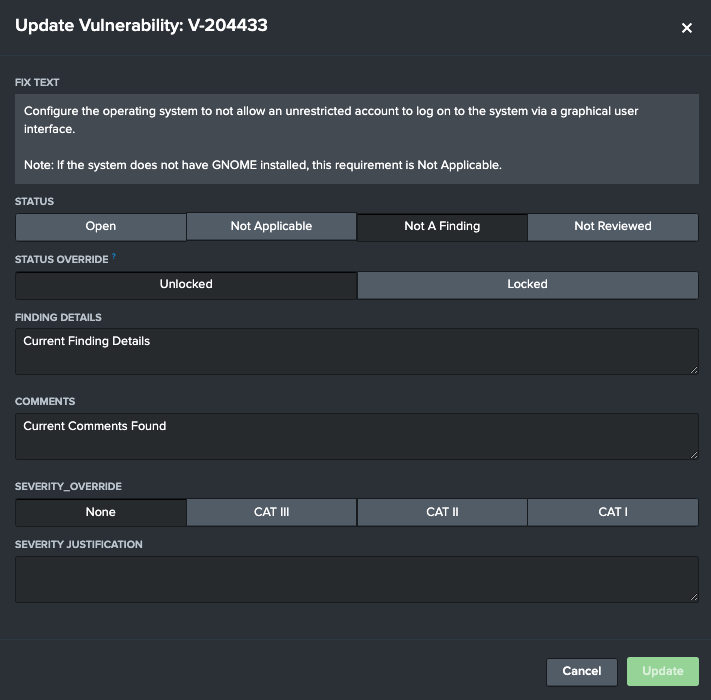
You can edit vulnerabilities using the Atlas STIG Compliance User Interface. Both the STIG Viewer interface and the Edit Checklists interface can be used to edit the Status, Finding Details, add Comments, or provide Status or Severity Override for a single vulnerability. This eliminates the need for you to edit your STIG checklists outside of Splunk and can also be used to bulk edit STIG vulnerabilities across many STIG checklists.
There are two priamry workflows that you can use to accomplish updating vulnerabilities in a STIG checklist within the STIG Compliance Element:
STIG Viewer's Update Vulnerability Modal
If a user wants to change one vulnerability on one target, the Update Vulnerability modal on STIG Viewer is the ideal place. When viewing a list of vulnerabilities on the STIG Viewer screen that are selected by your filters, you can select the Update Vulnerability button on the Checklist Browser.
This will open up the Update Vulnerability modal. This modal will reflect the current status of the vulnerability selected, from its status to its current comments and finding details identified. After any change is detected, the Update button will activate, allowing the user to save their changes to the vulnerability. The modal will not close automatically to support later edits. After each update, all visualizations on STIG Viewer will update to show the new changes.
Update Checklist Dashboard��
If a user wants to change one vulnerabilities on more than one target, the Update Checklist dashboard will enable the user to apply and append changes on multiple targets. Users can navigate to this page from the STIG Compliance navigation bar, or by selecting the Update Vulnerability button on STIG Viewer below the Change History table.
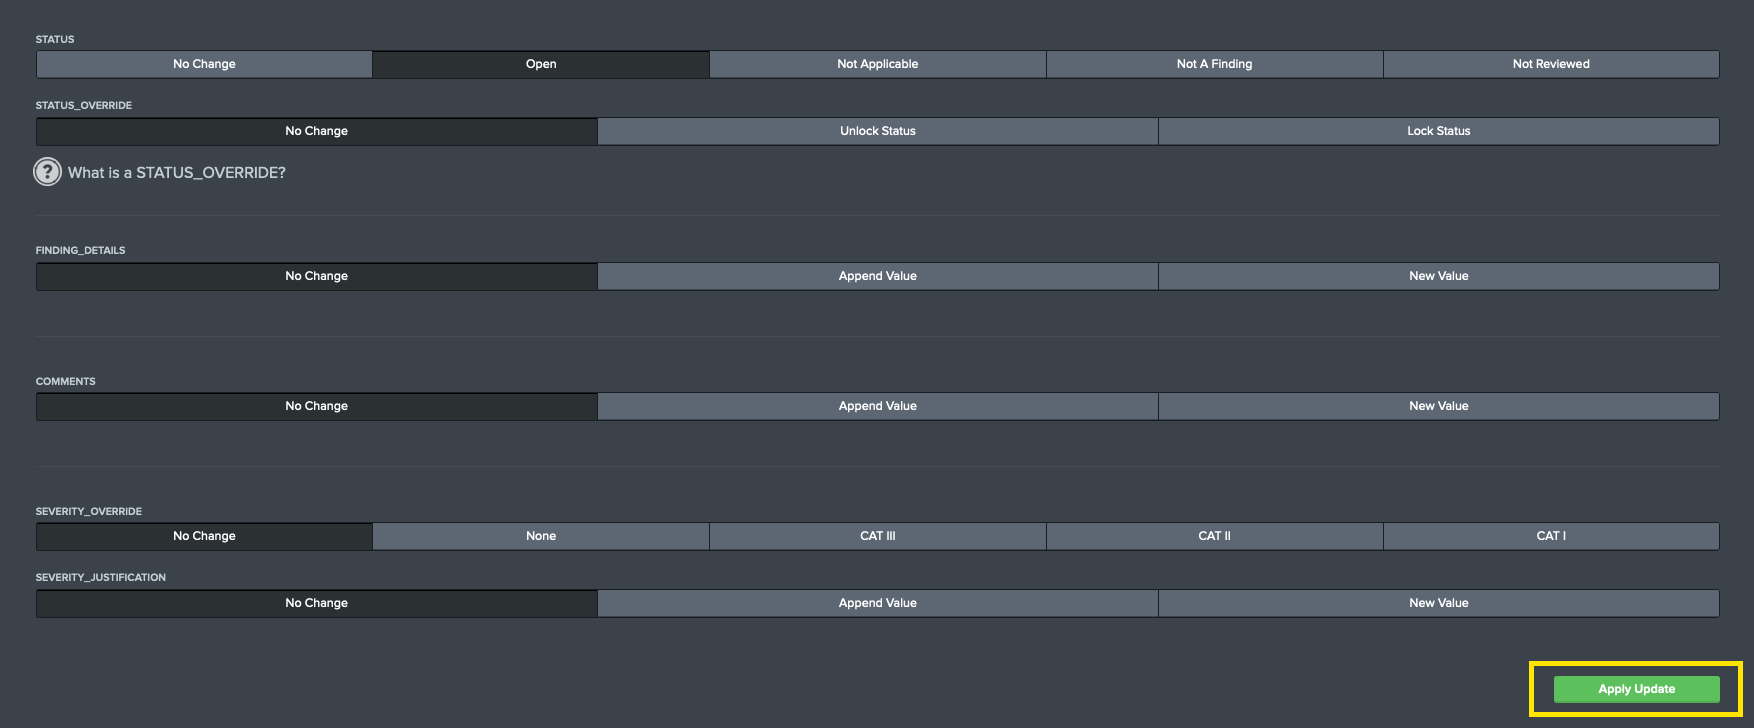
Using the filters at the top of the Edit Checklists page, users can select a combination of System, Targets, STIG and Vulnerability ID to populate the screen with the details for the vulnerability they want to update. Once the screen populates with details, a list of vulnerabilities has been found in the system. From here, users will be able to update vulnerability details across multiple STIG checklists across many targets. The number of STIG checklists updated is controlled by what is selected in the filters at the top of the page. All affected targets will be listed in the Selected Vulnerability
When you are ready to apply your updates, you will click the Apply Update button in the bottom right corner fo the screen. You will be prompted with a modal that will summarize the updates that will be applied to the STIG Checklists stored in Splunk. If you are confident that these are the correct changes, click OK. Otherwise you should click the Cancel button and adjust your updates before committing your changes.
Field Descriptions
Users can update the following fields on STIG Vulnerabilities using both methods described.
| Field | Usage | Values | Description |
|---|---|---|---|
| Status | STIG Checklist | Open, Not Applicable, Not a Finding, Not Reviewed | Use this field to set the status of a vulnerability |
| Status Override | STIG Checklist | Unlock Status, Lock Status | This is a custom field used by Atlas STIG Compliance. Since it is designed accept the status of the latest data source ingested by Splunk, the Status value will update based on the last value ingested by Splunk. The Status Override option allows you to "lock" a value so that it will not be overridden by data ingested into Splunk. The data will still be ingested but enabling the Status Override will prevent the Status field from being updated. This is useful for when you want to export STIG Checklists out of Splunk. |
| Finding Details | STIG Checklist | Append Value, New Value | This field allows you to either append or update the Finding Details field on the STIG Checklist |
| Comments | STIG Checklist | Append Value, New Value | This field allows you to either append or update the Comments field on the STIG Checklist |
| Severity Override | STIG Checklist | None, CAT III, CAT II, CAT I | This is the Severity Override field from DISA's STIG Viewer tool |
| Severity Justification | STIG Checklist | Append Value, New Value | This is the Severity Justification field from DISA's STIG Viewer tool |
Implementing Status Override
Atlas STIG Compliance continuously monitors the status of vulnerabilities being provided by external data sources. This means that if there are multiple sources sending the status of a vulnerability into Splunk, it will consider the last one it received to be current status. Sometimes it might be desirable to override this behavior and keep the status of a vulnerability 'locked' so that incoming data does not change the value. In Atlas STIG Compliance this is called Status Override.
If a Status Override is set on a vulnerability, this is the status that will be displayed throughout the STIG Compliance app, and will be the status that is exported from Splunk. The Status Override field can be removed (or unlocked) at any time, and the status will be reverted to the vulnerability's true status from the last known data source. When a Status Override is set, the latest status will still be updated and recorded in STIG Compliance as normal, however the latest status will only be visible on the Edit Checklists dashboard.
Navigate to the Edit Checklists dashboard, and select the vulnerability which you would like to edit. Optionally narrow down the targets using the filters provided at the top of the page.
Take note of the Most Recent Annotations by Targets table. Columns 2 and 3 show the Status and Status_Override of each target selected. Here Status is the latest status as recorded in the most recent data ingested into Splunk, while the Status_Override field will be the status displayed and exported throughout STIG Compliance. If the Status_Override field is displaying 'none', that status is unlocked, and the latest status will be displayed and exported like normal.
Locking and Unlocking the Status of a Vulnerability
Navigate directly to the Edit Checklists dashboard or select the Update Vulnerability button while viewing a vulnerability on STIG Viewer dashboard. On the Edit Checklists screen select all of the targets that you want to lock the status of the vulnerability for. The list of targets currently in scope is displayed in the Most Recent Annotations by Targets table on this page. In this table, the Status Field is the latest status and the Status Override is the value that the vulnerabilities are locked to, if currently set.
If desired, you can change the list of targets by changing the filters at the top of the page. Once you have the desired list of targets selected, scroll down to the Status Override selector and set it to Lock Status. Scroll down to the Apply Update button to save the Lock.
A Lock Icon will be visible next to the vulnerability status on the STIG Checklist page when a lock has been applied.
To unlock a status simply perform the steps above but select the Unlock Status option.
Targets Dashboards
Target Overview
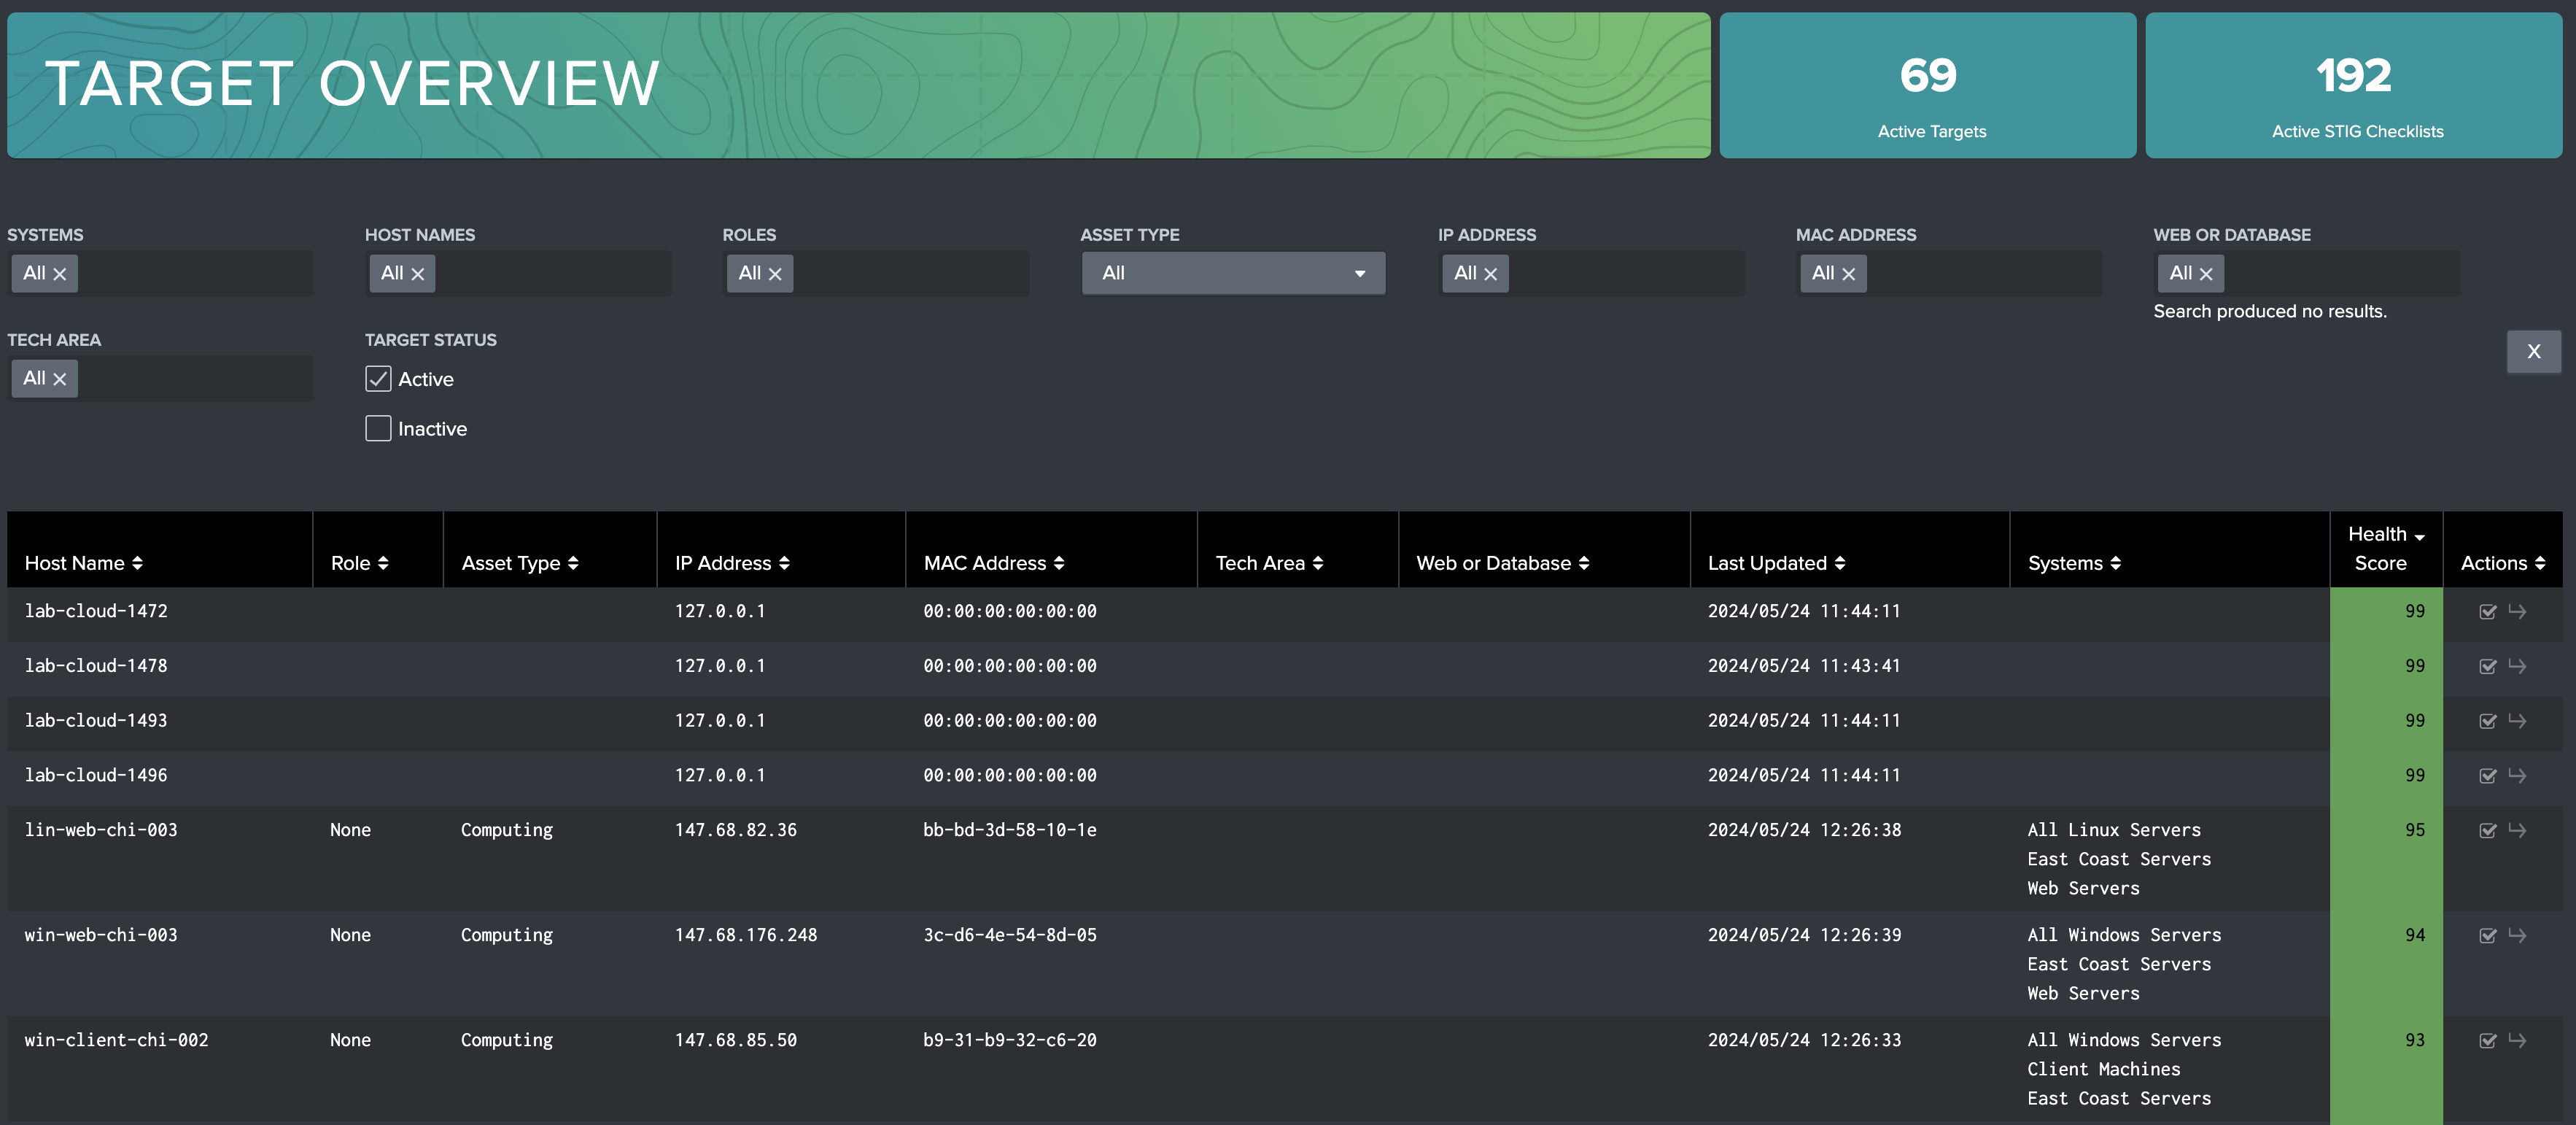
The Target Overview dashboard is built to provide a high level view on all targets in the selected filters. On this dashboard, users can see Target names and meta data such as IP Address and Roles from a list view, and get latest health scores. Leveraging the filters, users can filter by System specific host names, tech areas, and more, enabling quick discovery. By selecting the Go To arrow in the Actions column of the table, a user will be automatically directed to the identified target on the STIG Viewer dashboard.
Users can also filter by Active or Inactive status, which is shown by a check (Active) or a lack of one (Inactive) in the Actions column.
Inactive Targets
On the Target Overview dashboard, a user can mark a target Inactive, or mark it Active if its currently Inactive. An Inactive STIG Compliance target will experience the following characteristics:
-
The Target will not be shown on any visualizations outside of Target Overview (when the Inactive filter is selected)
-
Will not be leveraged to calculate overall system health scores shown on System Overview and System Compliance dashboards
-
Will not be exportable on Export Data or Export Checklist dashboards
-
Vulnerabilities and checklists associated with the target will not be editable inside the STIG Compliance application
-
Checklists being ingested through data ingests will still be tracked, and will be leveraged as normal if the target is marked Active later
Setting a Target to Inactive
On the Target Overview dashboard, identify the target(s) to mark Inactive on the table. Select the checkbox in the Actions column to deselect the target. Users can deselect as many as they want. Unselected targets are Inactive, and won't be considered in STIG Compliance visualizations.
When the selection process is complete, hit the 'Update Targets' button. This will save the selection, and reload the page. Inactive targets will only appear on this dashboard if the Inactive option on the Target Status filter is selected.
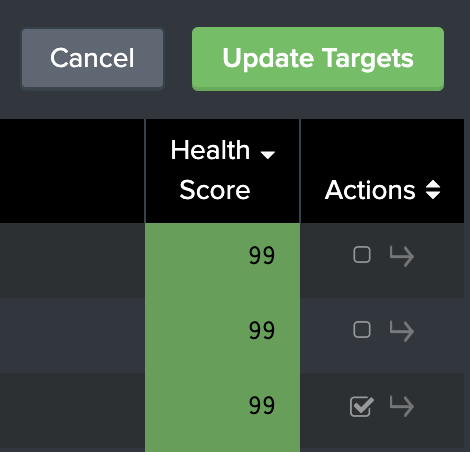
To Activate a target that has been marked Inactive, ensure that the Target Status filter has Inactive selected to see Inactive targets in the table. Inactive targets lack a check in their checkbox in the Actions column. Select the empty boxes, applying a check to them, on the Inactive targets identified for activation, then press the 'Update Targets' button. These targets will now appear in the STIG Compliance element.
STIG Library
The Atlas STIG Compliance app comes with the entire collection of unclassified STIGs provided by DISA pre-loaded into the Atlas app. Use STIG Library to search the latest available STIGs and assign them to targets on your system. The Save as Checklist feature will apply the given STIG to a target or a group of targets, marking any unknown vulnerabilities as Not Reviewed. This allows users to begin the compliance journey for new targets on their system directly from the Splunk UI.
These are the primary tasks you can accomplish with the STIG Library tool:
-
Lookup most of the latest unclassified STIGs published by DISA for reference
-
Create a STIG checklist for a target or targets and add it to your inventory in the STIG Compliance App
-
Convert SCAP results for a target into a STIG Checklist already in your inventory
STIG Library Interface
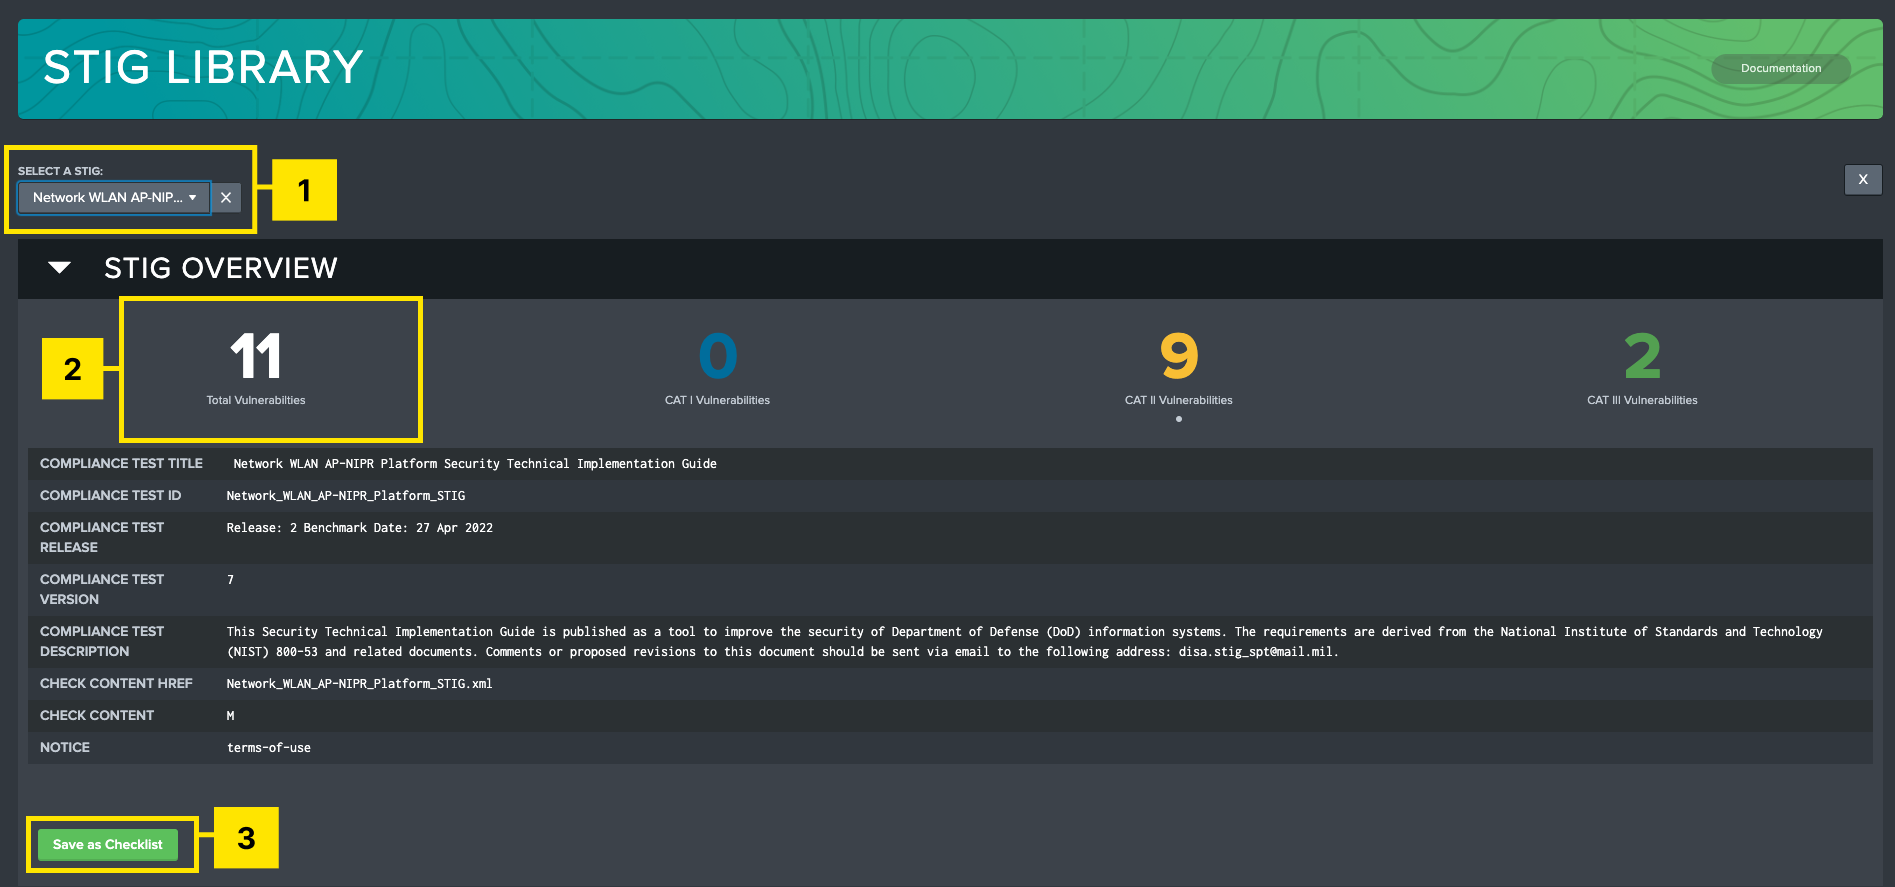
-
STIG Selection: Select a STIG from a searchable dropdown list. This must be populated for the rest of the page to become visible. Selection options are based off DISA’s current release of STIGs (Updated with every App version), as well as any additional STIGs added manually.
-
Vulnerabilities Overview: Displays how many vulnerabilities are present in the selected STIG based on their severity.
-
Save as Checklist: This feature will display a modal which will allow the user to assign targets to the selected STIG. The user has the option to add additional data to any currently tracked targets, as well as add new targets to the system with a blank STIG checklist assigned to them.
-
Vulnerability Browser: Filter and view all vulnerabilities for a selected STIG.
-
Vulnerability Display: Shows all of the information associated with that vulnerability.
Create a New STIG Checklist from STIG Library
STIG Library is your starting point for manually adding STIG Checklists to your inventory in Splunk without having to ingest anything into Splunk. The Save as Checklist feature can be used to convert incomplete compliance data, such as a SCAP scan, into a full STIG checklist. By performing a Save as Checklist operation on a target that has SCAP data recorded for it, Atlas will fill in the gaps for you by adding any missing vulnerabilities as Not Reviewed.
-
Navigate to the STIG Library dashboard
-
Select the STIG from the list that you want to add
-
Click the Save as Checklist button
-
On the modal that appears, select the Existing Target button if you want to assign it to a target that is already in your inventory or select New Target if you want to create a STIG checklist for a new target that is not in your current inventory. If you are selecting an existing target(s) select them from the 'Available Targets' list on the left and move them to the 'Selected Targets' column. If you are selecting a new target you will need to provide the required information about the target. At a minimum, you must provide the Host Name. These selections mimic the information requested in the DISA STIG Viewer.
-
Select the Splunk Index being used to hold your STIG compliance data. Leave this as the default if you have not created custom indexes for the STIG Compliance data.
Atlas STIG Compliance comes pre-loaded with the currently supported Unclassified STIGs published by DISA on the Cyber Exchange website. Each version of STIG Compliance should provide the user with everything they need to STIG their systems in accordance to current DISA guidance. There are however cases where additional STIGs must be added to the system, for example if the user is tracking STIGs in a classified environment, or simply keeping compliance data for a system that is no longer officially supported by DISA.
STIG Compliance provides tooling to allow users to include additional STIGs for tracking on their STIG Compliance system. Once added, these STIGs will be viewable in the STIG Library and made available to add to targets for compliance tracking. Additionally, any ingested checklists pertaining to these STIGs will be automatically incorporated into the STIG Compliance system and have access to the full suite of tools available in the STIG Compliance app.
Adding STIGs to the STIG Library
The STIG Library comes pre-loaded with the STIGs that DISA provides on Cyber Exchange in their quarterly STIG compilations. Adding more STIGs to the STIG Library will be required if you want to report on STIGs that are not provided from this source or if you want to upgrade your STIGs to a later version than what is already in STIG Library. You can use this method to upgrade single STIGs or an entire compilation of STIGs.
Upgrading STIG Library can also be accomplished by upgrading the Splunk App if a new version of STIGs is released.
Atlas STIG Compliance provides a method for adding more STIGs as most users will find this to be necessary in their environment. Adding to the STIG Library is accomplished by putting the STIG template files on your Splunk Search Head and running a script in the STIG Compliance directory. The process to add new STIGs to STIG Library is as follows:
A STIG must be present in the STIG Library for it to show up in any of the STIG Compliance interfaces. The data will still be indexed in Splunk if it is being sent, but it will not be visible until the STIG is present in STIG Library.
-
Download the files for the STIGs from your preferred source. These are typically delivered in an archive file (.zip) that contains all of the relevant files provided by DISA. The file that is needed from the archive file is the XML file that should be named something similar to
mySTIG_Manual-xccdf.xml. A completed checklist file (.ckl) will not work here. These files will be skipped by the STIG template upload process. -
You must now copy your STIG Template file(s) to the Atlas Search head using the file transfer method of your choosing. Place the files in the
<SPLUNK_HOME>/etc/apps/atlas_stig_compliance/lookups/AddonSTIGs/directory. This is the default directory that the script will use to look for these files. You can also put them in another location and provide that path to the script. -
Log on to your Splunk Search Head where Atlas STIG Compliance is deployed and locate the file
<SPLUNK_HOME>/etc/apps/atlas_stig_compliance/bin/stig-library-addon.py. -
Execute the
stig-library-addon.pyscript from the command line using the command listed below. The script assumes that Python3 is installed on your Splunk environment. You can validate this using thepython --versioncommand. The path parameter is optional if you placed your STIG template files in the default directory listed above.
python stig-library-addon.py --path=<path to directory>
It is critical to note that any older versions of STIGs that are already in the STIG Library will be ignored by this script. STIG Library does not support having more than one version of a STIG loaded into the library at one time.
-
Upon execution the script look at the directory specified and will locate any file that ends with
xccdf.xmland will attempt to load it into the STIG Library. The script will provide output if there are any failures during execution. -
Upon successful completion of the script, validate that the new STIG(s) have been added to the system by searching the STIG Library dashboard for the STIG(s) that you expect to see. These STIG(s) should now also appear in the rest of the STIG Compliance app.
If you upgrade the STIG Compliance Element to a newer version, you must rerun this script to add any extra STIGs back to the library that you had previously added.
Reporting Dashboards
STIG Compliance comes with several pre-developed reports that can be used to accomplish different auditing and reporting tasks with the data you have in your STIG Compliance inventory. These reports utilize the power of Splunk to automate many tasks and help you to get data out of Splunk for other reporting purposes.
Vulnerability Changes Report
The Vulnerability Changes Report provides a single dashboard for reviewing change across Systems, Targets, and STIGs. This dashboard identifies specific vulnerabilities on targets that have experienced any fluctuations in their reported Status in a selected time range.
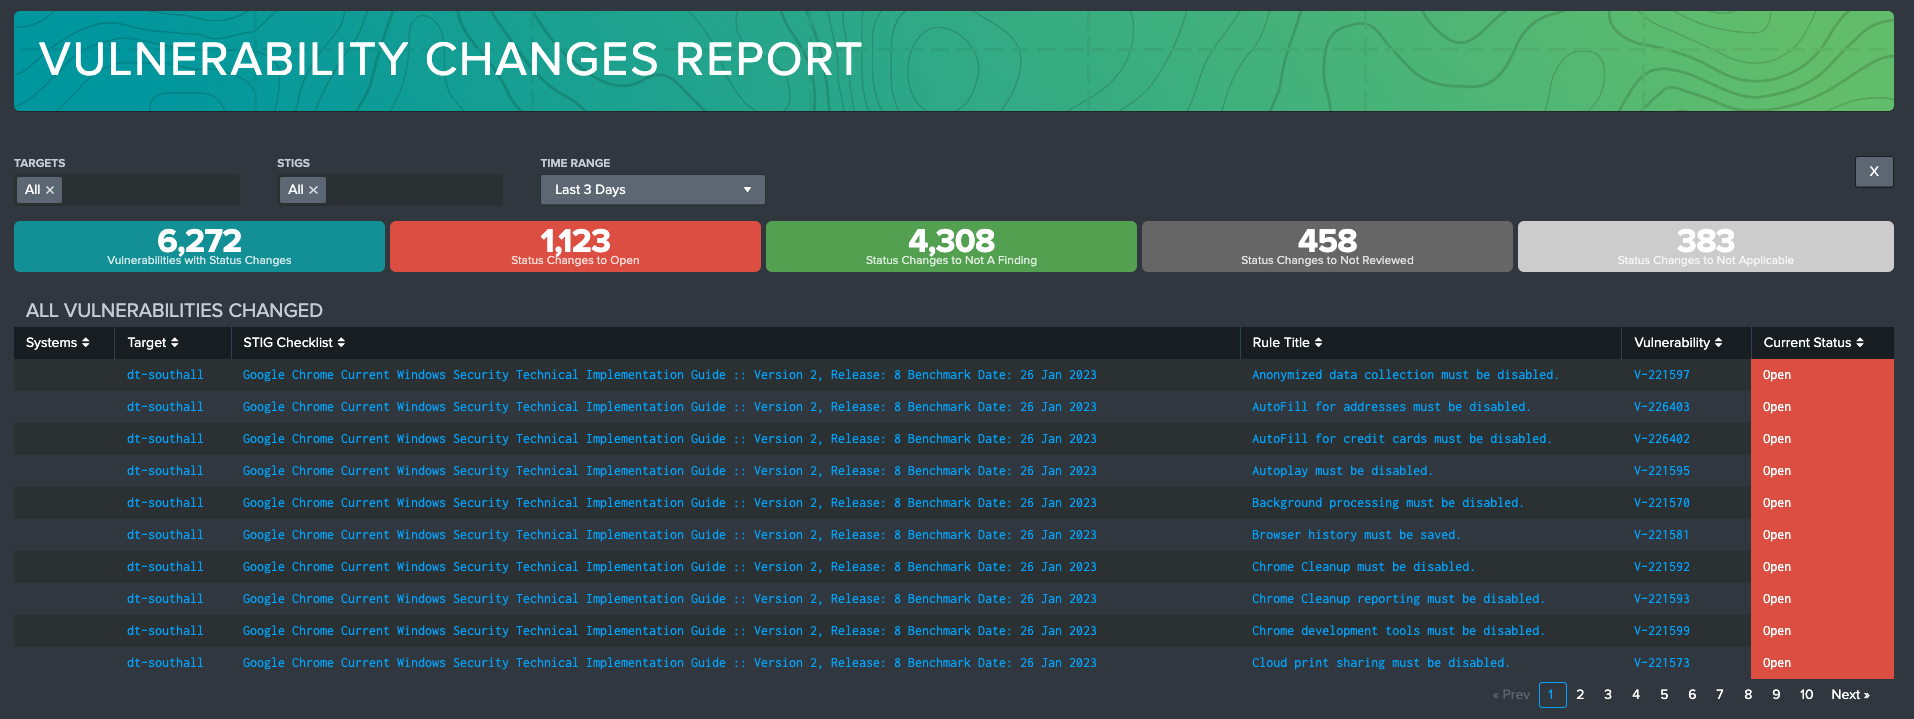
Vulnerabilities will appear on this table if there has been any data in the selected time range that does not match the current state of the vulnerability. This includes the following examples:
- A vulnerability that has been Not A Finding for the majority of the time range, but in the past hour has been marked Open, will be recorded as a status change to Open
- A vulnerability that was marked Open at the start of the time range, was briefly marked Not A Finding, and then was marked Open shortly after, will be recorded as a status change to Open
- A vulnerability that has just been ingested for the first time with the status Open will be recorded as a status change to Open
Selecting a status change KPI will filter the table to only show the vulnerabilities with that current status. Select the Vulnerabilities with Status Changes KPI to revert back to viewing all changes.
Selecting a vulnerability in the table will reveal an investigation table that shows all changes in the time range.
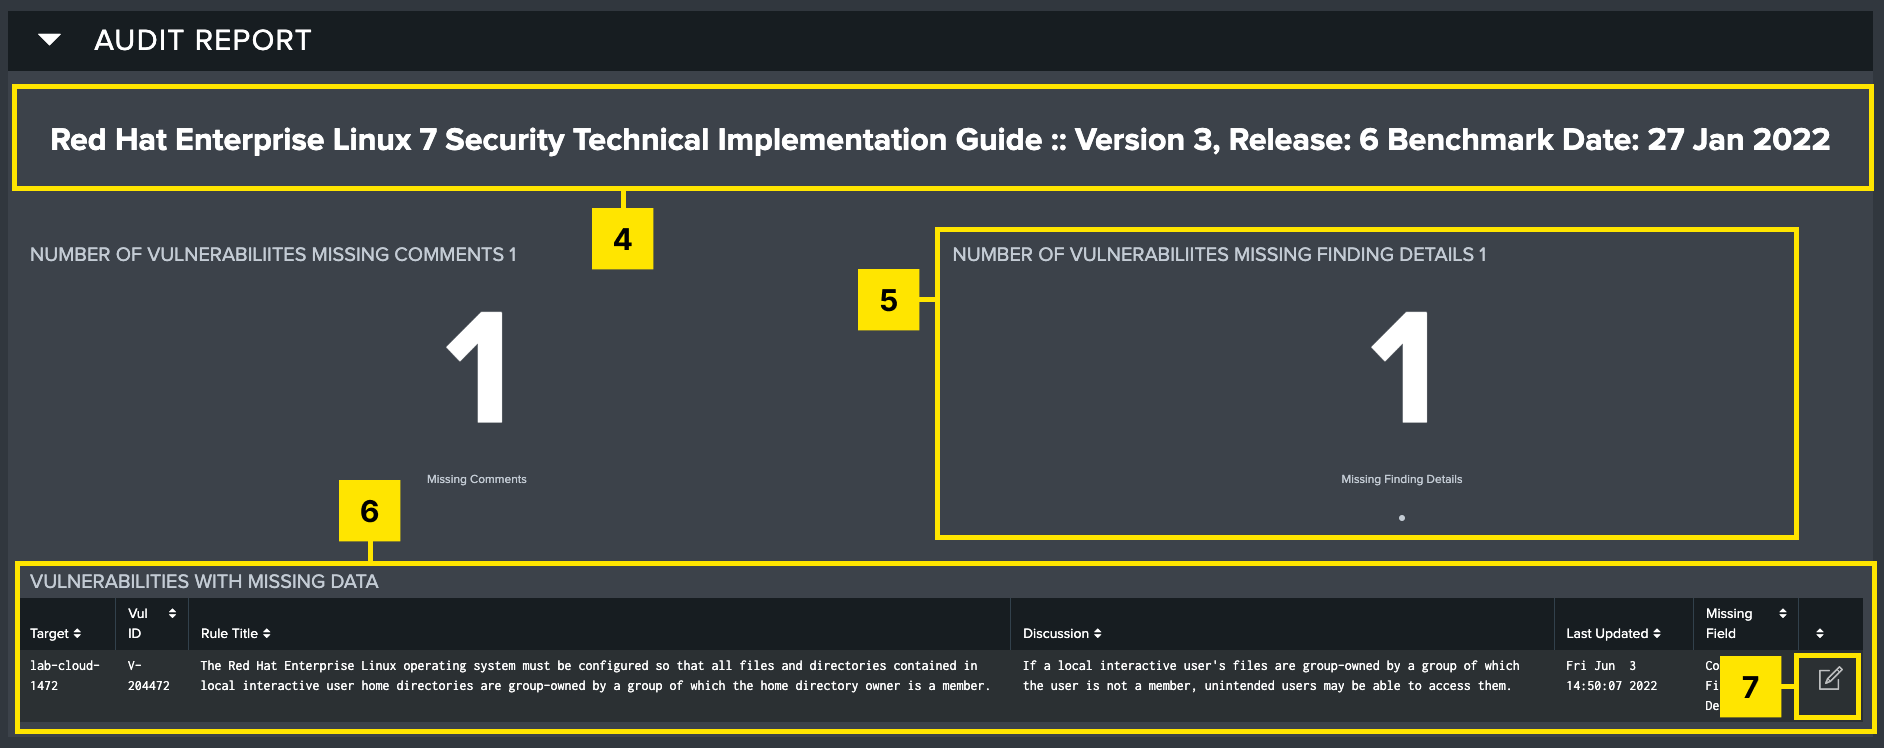
Checklist Audit
The Atlas STIG Compliance App provides an audit tool that can evaluate the STIG Checklists that you have in your inventory. The Checklist Audit report tool will look for STIG Checklists that have missing comments or finding details fields. You can then either export the list out to a csv file or you can edit the comments in the Splunk UI by clicking on the Edit icon next to the item in the report. Clicking the Edit icon will take you to the screen. There you can update the finding details or comments for that vulnerability across one or multiple targets.
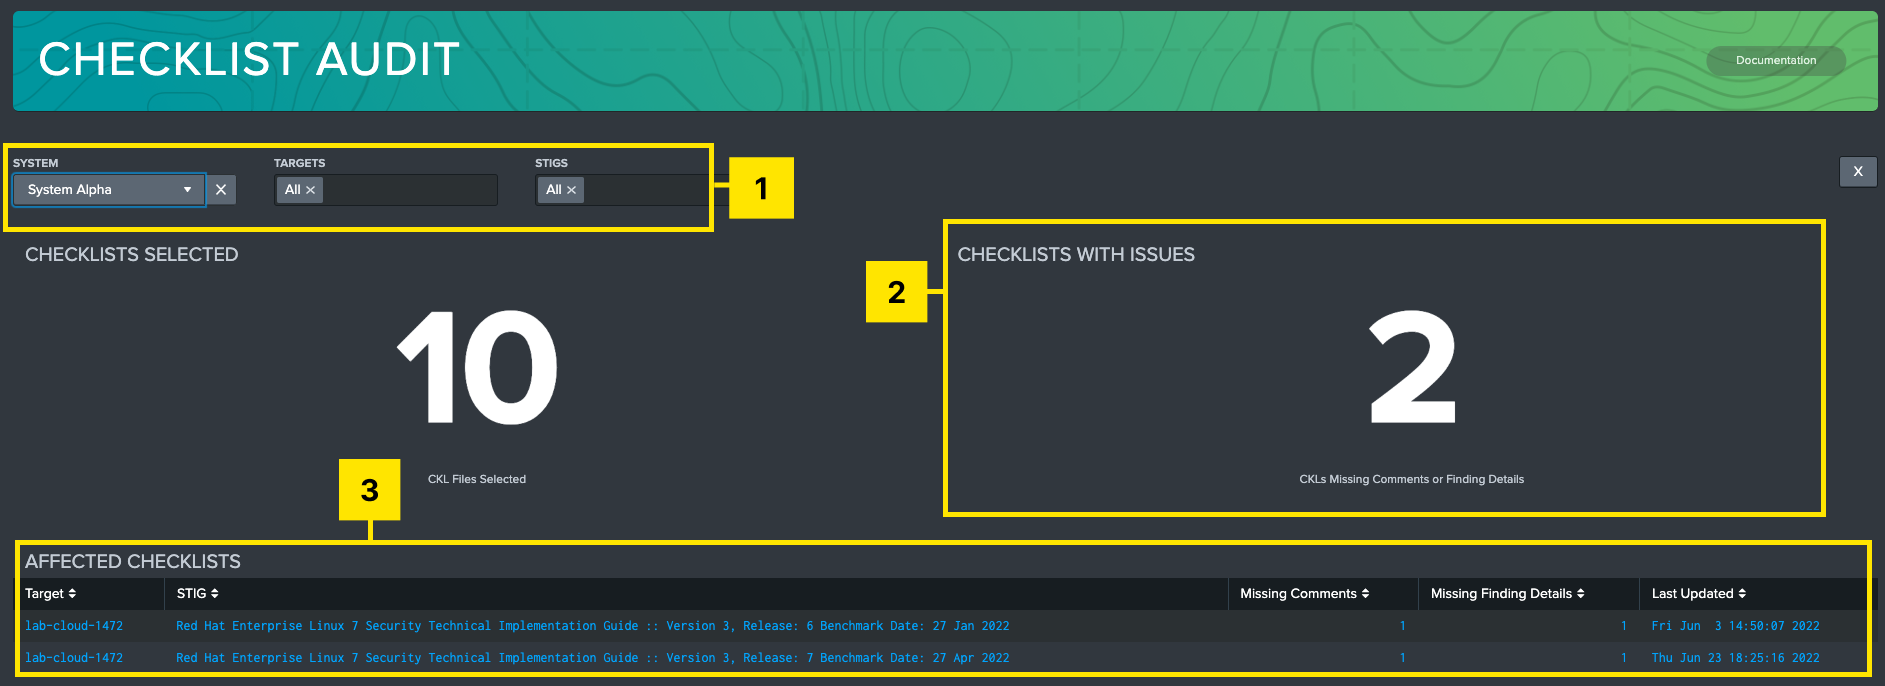
-
Filters: Filter by system, target machine, STIG, and time range of available data.
-
Checklist Summary: Shows total number of STIG checklist files selected, and how many of those have missing data.
-
Affected Checklists: Table of STIG checklists in the given filter criteria. Each row will give a description of the checklist, host, time of last import, and how many instances of missing data (Comments or Fix text) are present in that file. Selecting a checklist will prompt an Audit Report panel to generate below.
-
Title Block: STIG title for the selected checklist file.
-
Summary of Missing Info: Highlights the missing Comments and missing Fix Text for the selected checklist.
-
Vulnerabilities with Missing Data: Information about which specific vulnerabilities are missing data. Table presents identifying information about each vulnerability as well as what field is missing.
-
Edit: Button at the end of each row which will direct the user to the Edit Checklists page, with all applicable filters preset, so users can easily remediate missing data.
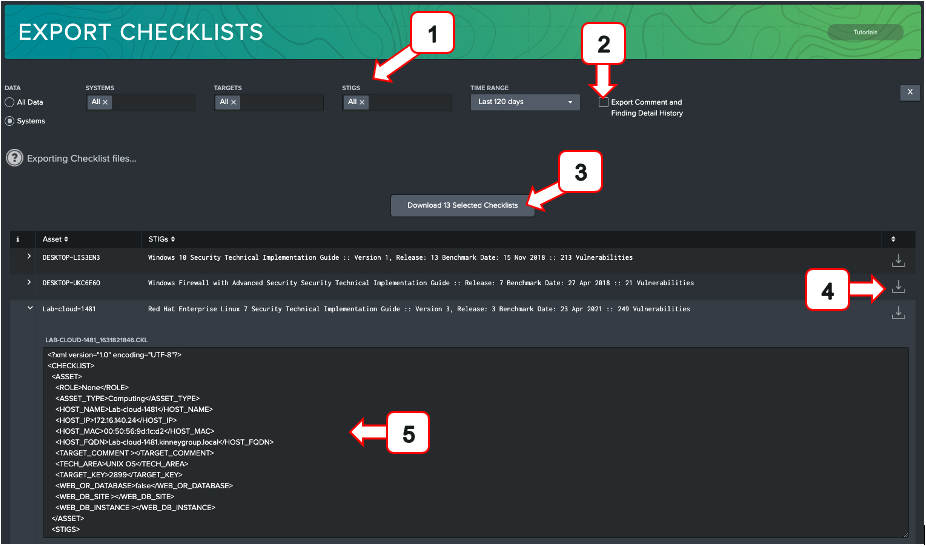
Export Checklist
The Export Checklist dashboard is used to easily export one or many STIG checklists to be transferred or viewed in the standard checklist format expected by the DISA STIG Viewer tool. This dashboard allows the user to either download individual checklists or download a zip file containing any number of checklists for the given search criteria provided in the UI.
-
Filters: Filter by system, target machine, STIG, and time range of available data. Additionally, toggle between searching specific named system or the entire suite of compliance data using the radio toggles.
-
Export Comment and Finding Detail History: Selecting this checkbox will append the five most recent Comments and Finding Details to each vulnerability, separated by a timestamp. Use this option to provide an audit trail of system changes. Leaving this unchecked will only export the most recent Comments and Finding Details.
-
Bulk Download: Selecting this will download all selected checklists as a zip file. The button will display how many checklists will be exported.
-
Download Individual Checklist: Use this to download the checklist for the displayed checklist in that row.
-
Preview Pane: Expanding any row will show a preview of what the checklist will look like on export. This is the standard checklist xml format used to view data in the DISA STIG Viewer.
To export STIG checklists from STIG Compliance use the following procedure:
-
Filter the data you want to export using the filters at the top of the page
-
Check the Export Comment and Finding Detail History checkbox if you want that data included in your STIG checklists
-
Select the Download Selected Checklists button to download a .zip file of all STIG Checklists selected
-
Select the Download icon next to the target in the list to download the STIG checklist for that target
-
If you want to preview the XML prior to downloading you can also do that by clicking on the arrow icon to expand the selection
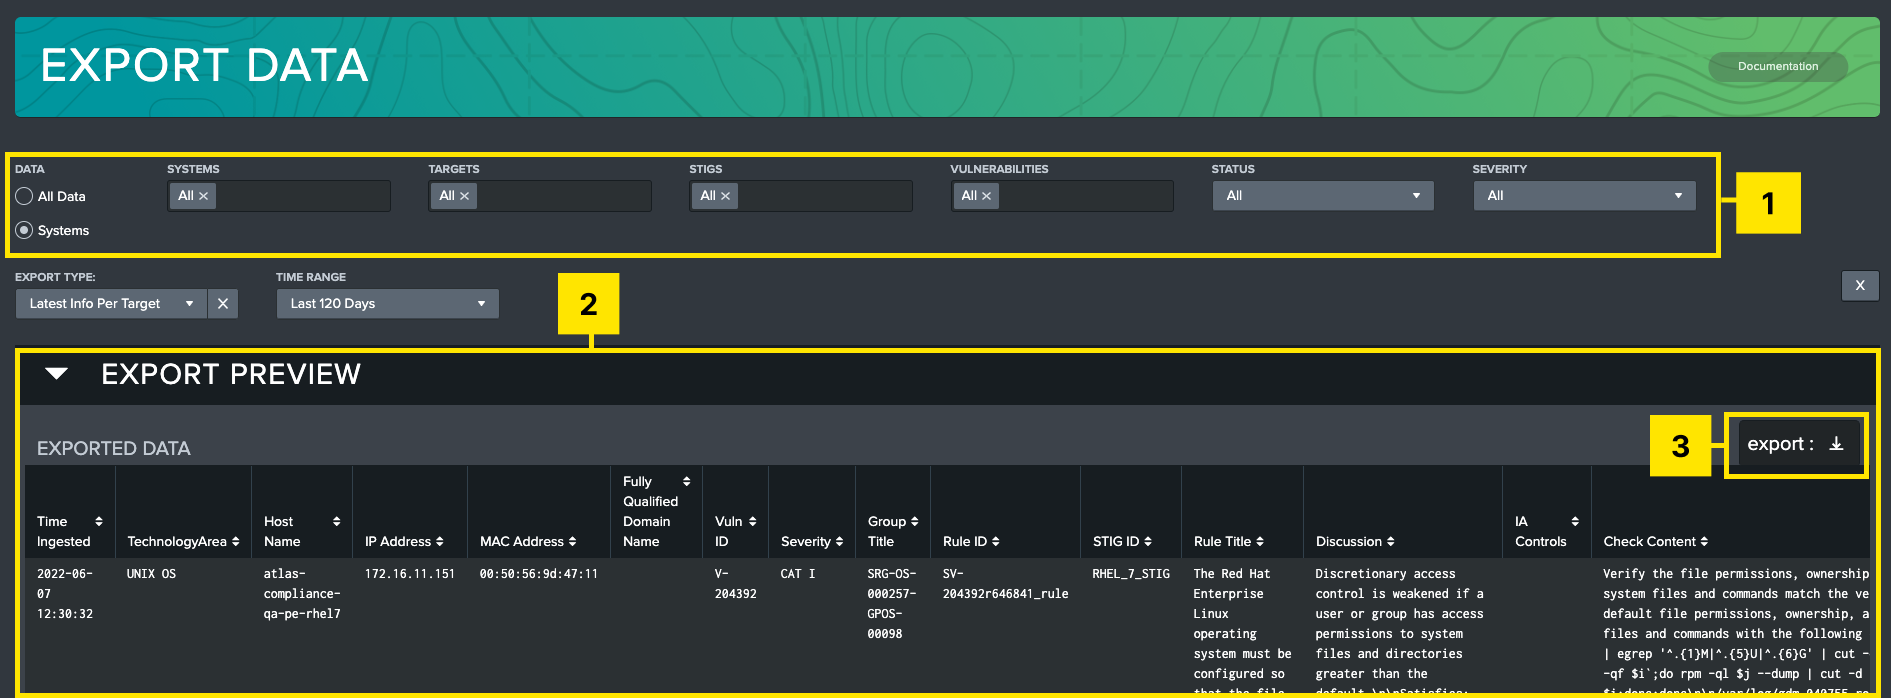
Export Data
The Export Data dashboard is a tool used to export a collection of checklists based on filter criteria. This tool can be used to automate generation of POA&M lists or provide an aggregate list of controls to appropriate stakeholders. This can also be used to export data to additional systems in csv, xml, or json format.
-
Filters: Allows user to filter by system, target machine, STIG, vulnerability, status, vulnerability, and time options.
-
Export Preview: Shows a preview of selected data based on filters. Hover over this table to expose the export button.
-
Export button: Presents a modal to the user to allow the data to be exported as CSV, XML, or JSON.
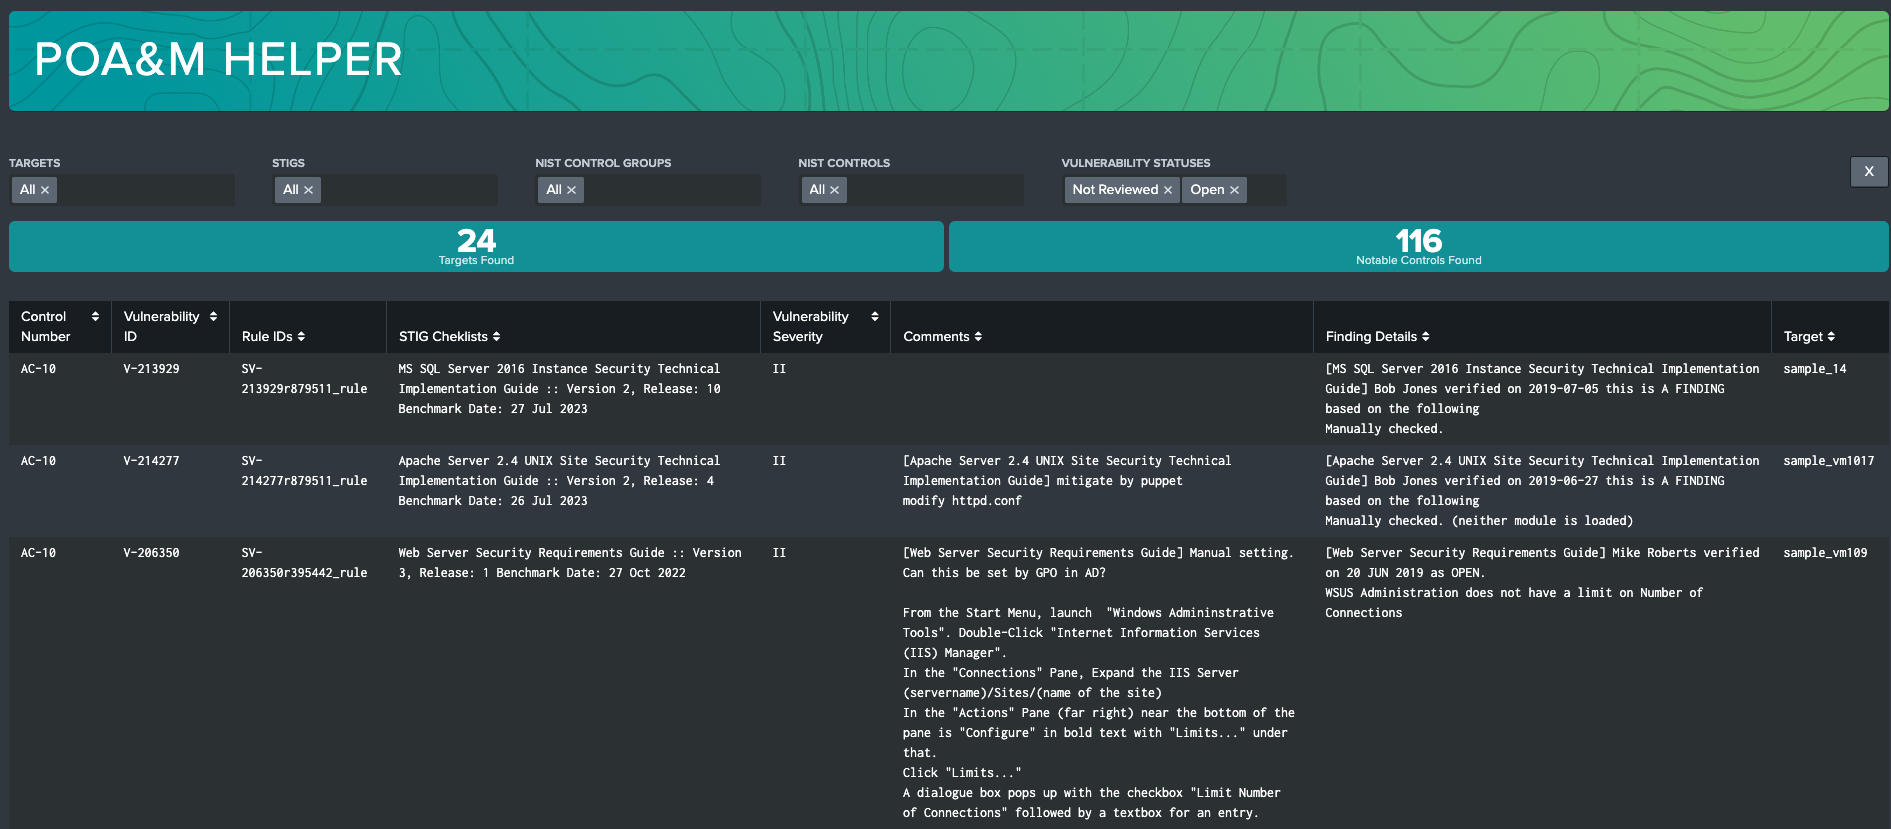
POA&M Helper
The POA&M Helper dashboard is a powerful tool that uses CCI correlation data to join STIG Vulnerability data back to RMF Controls. Users can filter by System, Targets, STIGs, NIST Control Groups, and individual NIST Controls to create reports that meet their needs. Using this dashboard, users can jump-start POA&M creation by identifying notable NIST Controls with vulnerabilities with statuses selected in the Vulnerability Status filter (defaults to Not Reviewed and Open). This can be used to find Controls that have associated open vulnerabilities to better understand overall RMF Compliance.
Data Collection
The Data Collection dashboard records the successes and failures of all checklist and SCAP data ingests into the STIG Compliance element. It is useful for tracking errors on ingest, and it will record what error messages were recorded. Users can filter on target names, ingest status, origin forwarder name, and if the data is a Checklist (CKL) or SCAP scan.
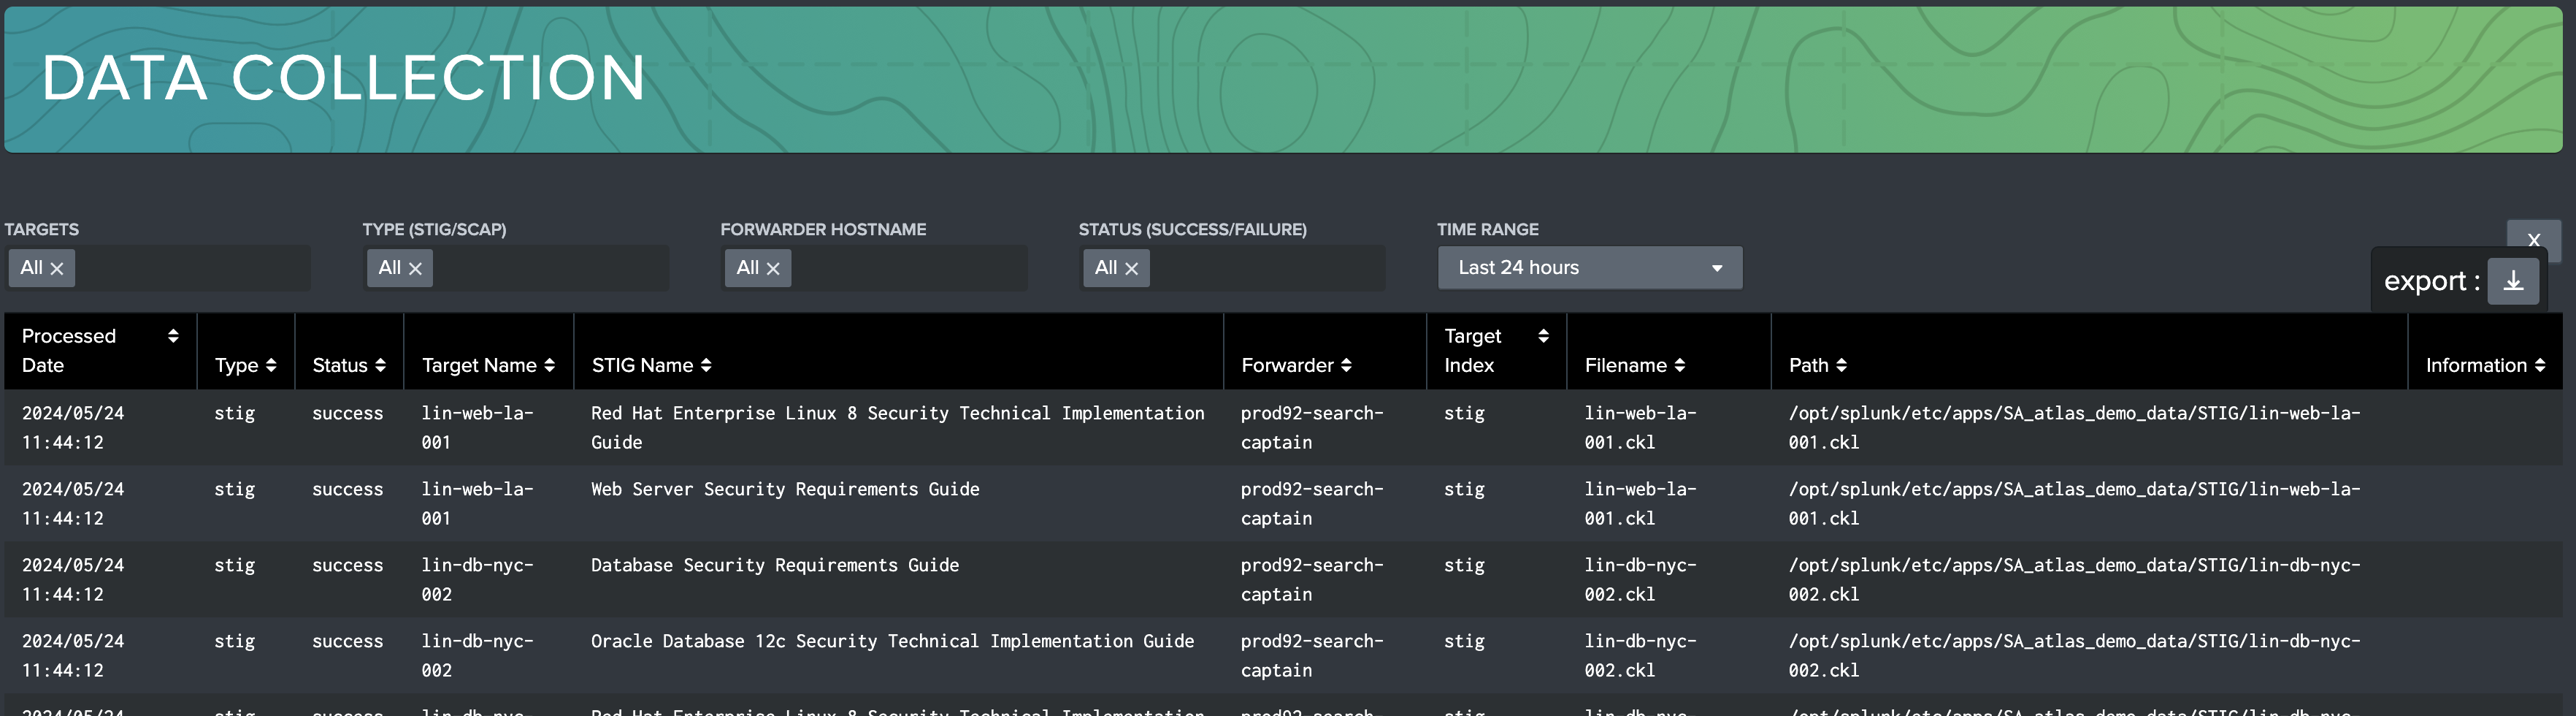
Leverage this dashboard whenever data is not properly appearing in the STIG Compliance environment.
Promoting STIG Checklists to New Versions
STIG Compliance subscribes to the concept of "auto-promotion" of STIGs which means that the STIG Compliance App will automatically upgrade your STIG Checklists to the latest version loaded into STIG Library. This means that if you upgrade a STIG to a later version by updating the STIG Library or upgrading the STIG Compliance Atlas Element the version of the STIG Checklist will automatically be upgraded.
The auto-promotion process that STIG Compliance uses does not evaluate the content of the STIGs to see if anything has changed. It assumes that you want to carry your vulnerability statuses forward to the new version.
You must manually determine if there have been STIG changes between versions that impact your implementation. This is critical to ensure that your documentation matches your actual system configuration. STIG Compliance does not validate or evaluate the changes between STIG versions.
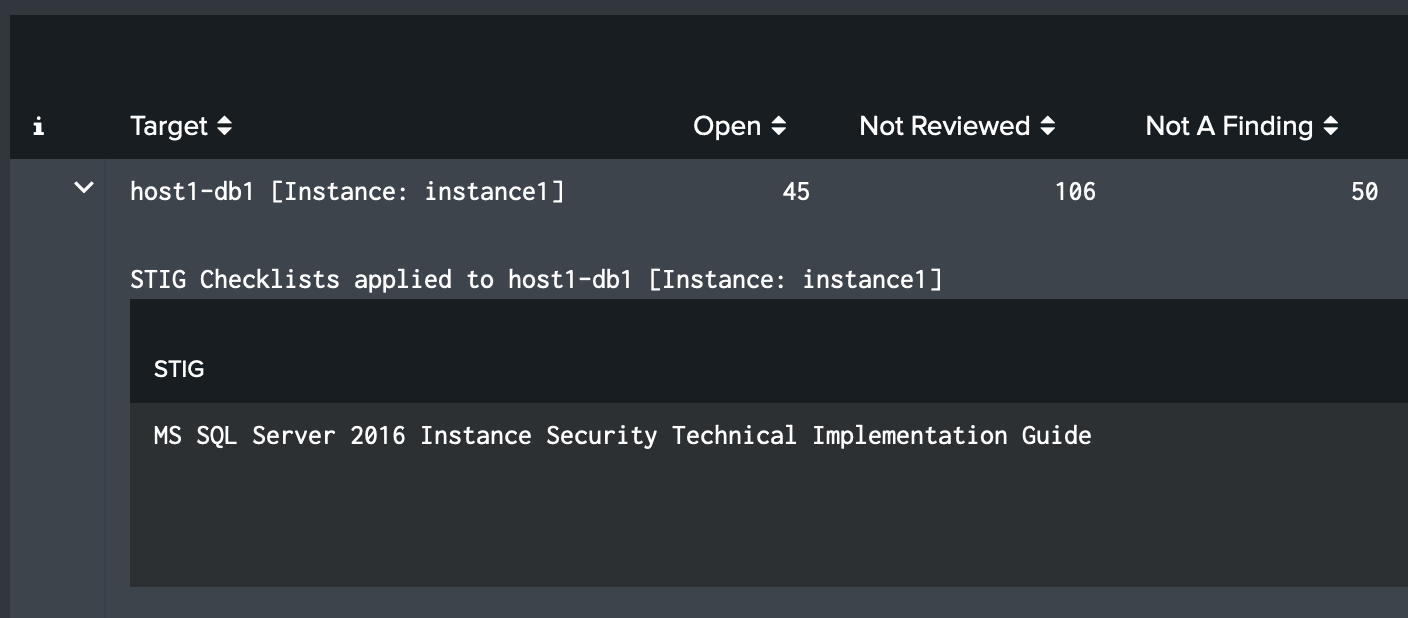
Web and Database Instance STIGs
A STIG checklist contains optional fields that are typically used for web and database instance STIGs. Atlas STIG Compliance treats these fields different than other STIG checklists. Each instance is automatically treated as a separate target. This means that if you have STIG that is for a database server and then have instance STIGs for each of the databases on that server, they must be their own target. This is similar to how DISA's STIG viewer handles this type of STIG. Instance STIGs that have the Web or Database fields populated will be automatically assigned as a new target named using the values from the hostname field and the value(s) from the web and/or instance fields.
For example, a STIG checklist for a host named 'host1-db1' with a value of 'instance1' in the instance field, the target will automatically be named 'host1-db1 [Instance: instance1]' by STIG Compliance. You will have to assign these targets to your systems just like you do any other STIG.
The Site field works exactly the same way. If a host named 'webserver1' with a value of 'site1' in the Site field, the target will automatically be named 'webserver1 [Site: site1]'.
If both the web and instance fields are populated with values STIG Compliance will use both values and create a target with both site and instance in the name.
Updating Existing STIG Data to utilize Web and Database Instance STIGs
If you have STIGs in your inventory that use the web and/or database instance field in the STIG checklist (this would be prior to STIG Compliance v1.6.0 in Atlas v2022.3.2), you must follow these steps below to make sure they appear in STIG Compliance correctly. If you have not been utilizing the web or database instance fields, or have not installed STIG Compliance prior to 1.6.0, this does not apply to your STIG Compliance installation.
-
Upgrade Atlas STIG Compliance to version 1.6.0 (Atlas V2022.3.2) by obtaining the package from the customer portal
-
Manually execute the Atlas STIG Compliance State search found in the Search and Reporting App with a time range that includes the most recent STIGs with the web and database instance fields used
-
Manually execute the Update Compliance State search listed below to correctly label the state of targets